• Home
  • Forums
  • Trades
  • News
  • Calendar
  • Market
  • Brokers
  • Login
  • Join
  • User/Email: Password:
  • 12:16pm
Menu
  • Forums
  • Trades
  • News
  • Calendar
  • Market
  • Brokers
  • Login
  • Join
  • 12:16pm
Sister Sites
  • Metals Mine
  • Energy EXCH
  • Crypto Craft

Options

Bookmark Thread

First Page First Unread Last Page Last Post

Print Thread

Similar Threads

Fundamental Analysis, Technical Analysis Or Graph Analysis? 28 replies

long eur/jpy, gbp/jpy, usd/jpy 11 replies

EUR/GBP, EUR/USD, GBP/USD, AUD/USD, CAD, NZD, JPY, and more... 14 replies

eur/usd, eur/jpy, usd/jpy average 0 replies

Gbp/jpy = Gbp/usd X Usd/jpy ?? 5 replies

  • Interactive Trading
  • /
  • Reply to Thread
  • Subscribe
  • 841
Attachments: GBP/JPY, GBP/USD, and EUR/USD (technical analysis)
Exit Attachments

GBP/JPY, GBP/USD, and EUR/USD (technical analysis)

  • Last Post
  •  
  • 1 135136Page 137138139 155
  • 1 Page 137 155
  •  
  • Post #2,721
  • Quote
  • Sep 4, 2011 5:26pm Sep 4, 2011 5:26pm
  •  forextryer
  • | Joined Nov 2010 | Status: Member | 5 Posts
Quoting cohiba pips
Disliked
I regard the thread starter a friend and I try and respect peoples wishes or thoughts regarding posting first page/post below maybe you missed it ( ha )

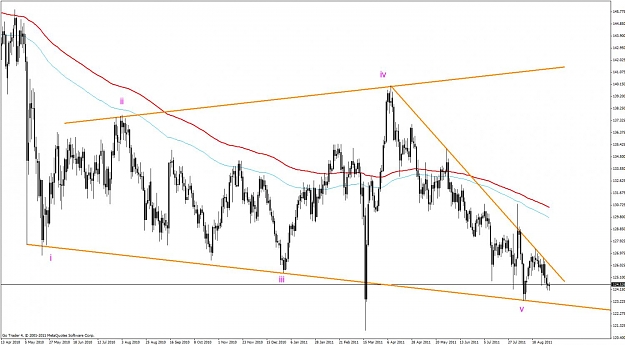
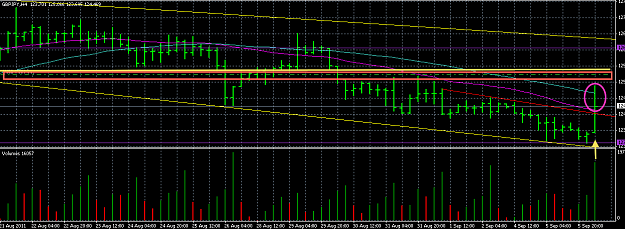
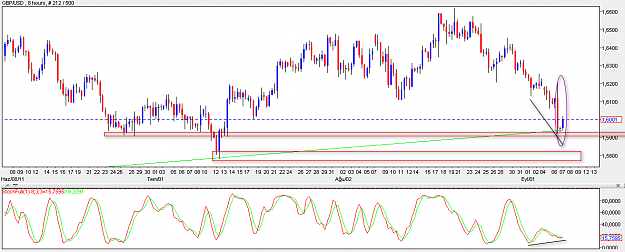
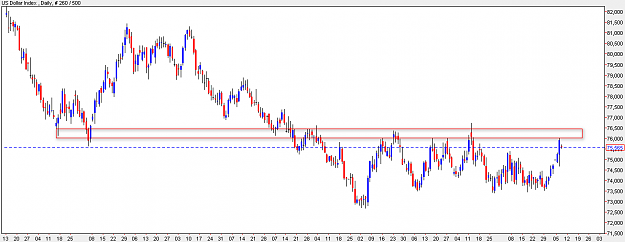
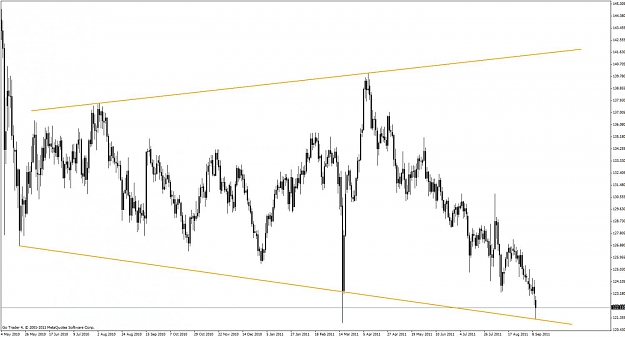
we will freely discuss technical analysis regarding gbp/jpy, gbp/usd, and eur/usd.
constructive discussions are welcome, but no chest thumping activities, and no trade calls. please be logical as possible about your TA when posting. have fun guys.

you have shown no respect for this at all and just recently pk posted what he tried to do in respect to posting which...
Ignored
I am not an established trader with a system in place that allows me to tally win after win in my trading. I looked to this thread, as well as a few other threads, to help enlighten me in trading the GBP/JPY pair.

The thread, as well as some others, has now been hijacked by some very arrogant individuals insisting on forcefully changing the threads core beliefs into a thread that they could not have created on their own. That is the reason you need to be vouched for before you can begin a thread in the Forex Factory community.

I can only hope that any senior contributors to the thread will consider taking up where PK left off and begin a thread of your own. The knowledge and experience you have contributed will be greatly missed.

I am not interested in seeing trade calls but useful information about the pair that will allow me to become more knowledgeable on trading this cross make my own trade calls.
 
 
  • Post #2,722
  • Quote
  • Edited Sep 5, 2011 3:02am Sep 4, 2011 9:23pm | Edited Sep 5, 2011 3:02am
  •  Mpt
  • Joined Nov 2009 | Status: Member | 2,582 Posts
Forextryer quote : "The thread, as well as some others, has now been hijacked by some very arrogant individuals insisting on forcefully changing the threads core beliefs into a thread that they could not have created on their own"

I tend to agree, as would others. One of the big problems, though, is that most GJ traders around here tend to trade the big waves or "swings" on GJ and when the pairing shows little sign of one of these swings, the GJ thread(s) updates can go very quiet. Of course, during that "intermission" period, the door always seems to be left open for others to, using your expression, "hijack" the thread. They always tend to be individuals who turn up to simply make trade calls, or try to push their ideas. I guess that is why this thread had its original rules - to help stop that sort of activity.

When trading GJ, one of the best pieces of advice I gleaned from someone who has long left FF was that GJ nearly always retraces/moves to the fib 76 level and it, more so than many other pairs, tends to repect trendlines. I have long found that those facts hold true.

Since the top at 140, GJ has been in a continual downtrend, with little indication of change. Hence the thread seeming to die and "others" popping in here to push their wares.

I suspect that this downturn may be about to change.

I offer two charts to support that statement. The first, an hourly chart, shows the pair as having retraced to the 76 of the move 123.3~126.3, wherein it has been observing well a downwards sloping triangle, often referred to as an "ending diagonal". For some time, there has been good divergence on the 1 hour. Having said that, it's always a real chance that it could still break down for a double bottom at around 123.3 or thereabouts. So, the moral of the story here is ... wait for a confirmed break out of the upper trend line if you think it's going to track north.

Attached Image (click to enlarge)
Click to Enlarge

Name: gjwave1.gif
Size: 31 KB


The second chart (daily) is very much open to argument. It shows GJ has possibly hit (and bounced off) a trendline at 123.3 and could be about to resume its move north. Of course, this TL may prove to be minor and an alternate view point discussed here some time ago has it that, after an initial bounce up to maybe the 128~131 area, it could resume its downtrend to around the 117~118 area, with the rapid move in March down to the 121 area really being a marker on a much lower trending TL. The simple fact that movements inside an expanding triangle tend to follow (at their simplest) a 3-3-3-3-3 pattern lends credence to the latter argument as we have not yet seen a clear 3 wave pattern in this downtrend. Then again, maybe it's not really an expanding triangle at all.

Attached Image (click to enlarge)
Click to Enlarge

Name: gjwave.jpg
Size: 107 KB


I hope that my arguments assist even a little, or at least give you something to think about.
 
 
  • Post #2,723
  • Quote
  • Sep 5, 2011 10:47pm Sep 5, 2011 10:47pm
  •  PandoraBox
  • Joined Apr 2007 | Status: Senior Principal Trader | 2,685 Posts
Since the volatility of this pair drop all senios trader left the forum.


Quoting forextryer
Disliked
I am not an established trader with a system in place that allows me to tally win after win in my trading. I looked to this thread, as well as a few other threads, to help enlighten me in trading the GBP/JPY pair.

[color=black][font=Verdana]The thread, as well as some others, has now been hijacked by some very arrogant individuals insisting on forcefully changing the threads core beliefs into a thread that they could not have created on their own. That is the reason you need to be vouched for before you...
Ignored
 
 
  • Post #2,724
  • Quote
  • Sep 5, 2011 11:26pm Sep 5, 2011 11:26pm
  •  Jackthepiper
  • | Joined Oct 2010 | Status: Member | 219 Posts
GBP/JPY:

major support level around 123.5-122.90...

buy at 123.6 sl 122.80.... i know 80pip sl but potentially i could net +1000 pips... or be dreadfully wrong and lose 80pips...time will tell
Attached Images (click to enlarge)
Click to Enlarge

Name: no.GIF
Size: 87 KB Click to Enlarge

Name: no1.GIF
Size: 87 KB
 
 
  • Post #2,725
  • Quote
  • Sep 5, 2011 11:45pm Sep 5, 2011 11:45pm
  •  Mpt
  • Joined Nov 2009 | Status: Member | 2,582 Posts
Quoting Jackthepiper
Disliked
GBP/JPY:

major support level around 123.5-122.90...

buy at 123.6 sl 122.80.... i know 80pip sl but potentially i could net +1000 pips... or be dreadfully wrong and lose 80pips...time will tell
Ignored

I agree. If the previously posted expanding triangle pattern is valid, then you're talking 2000 pips to the top.
 
 
  • Post #2,726
  • Quote
  • Sep 5, 2011 11:56pm Sep 5, 2011 11:56pm
  •  Jackthepiper
  • | Joined Oct 2010 | Status: Member | 219 Posts
Quoting Mpt
Disliked
I agree. If the previously posted expanding triangle pattern is valid, then you're talking 2000 pips to the top.
Ignored
I didn't realize the pattern until you pointed it out...
 
 
  • Post #2,727
  • Quote
  • Edited at 5:55am Sep 6, 2011 5:41am | Edited at 5:55am
  •  PipPipPip
  • | Joined Jan 2009 | Status: Member | 1,259 Posts
My sincere apology to the thread and those who I have offended for making trade calls. (didn't read the start of thread, and started reading half way). No intentions whatsoever to insult those. Just thought it might be helpful to do some good deed....

Speaking of technical analysis, volume and moving average target surges like these are quite dangerous; 4h bar target reached in its first hour. I was expecting a move like this within the end of the week.

Anyways, carry on all. Trade carefully and GL!
Attached Image (click to enlarge)
Click to Enlarge

Name: GJ 4H.png
Size: 47 KB
 
 
  • Post #2,728
  • Quote
  • Sep 6, 2011 6:02am Sep 6, 2011 6:02am
  •  PipPipPip
  • | Joined Jan 2009 | Status: Member | 1,259 Posts
Quoting plucker01
Disliked
Accumulation/Distribution indicator is on one of my charts. After Friday's close, I noticed this: 1H ( +9527) 4H (+56,238) D (-35,083), and then I looked at the 6H (-568,361). I never trade in the 6H time frame and wonder if anyone here could offer meaning why this number was much larger than the others?
Ignored
Accumulation
To accumulate means to buy as much of the instrument as possible, without significantly putting the price up against your own buying, until there are few, or no more shares available at the price level you have been buying at. This buying usually happens after a bear move has taken place in the market (which will be reflected by looking at the Index).
To the syndicate trader, the lower prices now look attractive. Not all of the issued instrument(pair/stock) can be accumulated straight away, since most of the instrument is tied up. For example, banks retain stock to cover loans, and directors retain stock to keep control in their company. It is the floating supply that the syndicate traders are after.
Once most of the stock has been removed from the hands of other traders (ordinary private individuals), there will be little, or no stock left to sell into a mark-up in price (which would normally cause the price to drop). At this point of ‘critical mass’, the resistance to higher prices has been removed from the market. If accumulation has taken place in lots of other stocks, by many other professionals, at a similar time (because market conditions are right), we have the makings of a bull market. Once a bullish move starts, it will continue without resistance, as the supply has now been removed from the market.

Distribution
At the potential top of a bull market, smart money or smart traders will be looking to sell stock or pairs bought at lower levels to take profits. Most of these traders will place large orders to sell, not at the current price available, but at a specified price range. Any selling has to be absorbed by the market-makers, who have to create a 'market’. Some sell orders will be filled immediately, some go, figuratively, 'onto the books‘. The market- makers in turn have to resell, which has to be accomplished without putting the price down against their own, or other traders’ selling. This process is known as distribution, and it will normally take some time for the process to complete.
In the early stages of distribution, if the selling is so great that prices are forced down, the selling will stop and the price will be supported, which gives the market-maker, and other traders, the chance to sell more stock on the next wave up. Once the professionals have sold most of their holdings, a bear market starts, because markets tend to fall without professional support.

so to answer your question, at that 6h timeframe timezone, massive supply/demand came in the market. (marketmovers)

Hope this is what you were looking for. gl!
 
 
  • Post #2,729
  • Quote
  • Sep 6, 2011 9:56am Sep 6, 2011 9:56am
  •  forextryer
  • | Joined Nov 2010 | Status: Member | 5 Posts
Thanks to all the members (Mpt, PandoraBox, Jackthepiper, PipPipPip & others) for your continued analysis. It is greatly appreciated by those of us who are beginning our journey into the world of Forex trading. I can only hope that from reading your posts and listening to your guidance I can become a trader who feels confidant to post my opinions. Thank You Very Much!
 
 
  • Post #2,730
  • Quote
  • Sep 6, 2011 3:33pm Sep 6, 2011 3:33pm
  •  plucker01
  • | Joined Mar 2010 | Status: Member | 152 Posts
Quoting plucker01
Disliked
Accumulation/Distribution indicator is on one of my charts. After Friday's close, I noticed this: 1H ( +9527) 4H (+56,238) D (-35,083), and then I looked at the 6H (-568,361). I never trade in the 6H time frame and wonder if anyone here could offer meaning why this number was much larger than the others?
Ignored
Similar 6H distribution patterns can be seen on all the JPN pairs I am thinking 6H TF is a good spot for the whales to swim, because many of us minnows cannot see this TF. GJ has doubled the 6H distribution # since the August high, and it went down another 20% since Friday. Many think we are on the launch pad ready for take off. Maybe so, but these #'s make me think there is more down to go. I hesitate to post because I am learning.
 
 
  • Post #2,731
  • Quote
  • Sep 6, 2011 10:46pm Sep 6, 2011 10:46pm
  •  trumpet
  • | Joined Jun 2011 | Status: Member | 57 Posts
Early today I was on a wild ride like the rest of you, after research and the imput from other traders, I am closeing my shorts, I think it is highly likely the Yen will follow suit with the Swiss, I have been tradeing since 2005 and I have never seen a market like this, I always use a Min. stop loss of 100 Pips with nthis pair, I think its time to make it larger! Mt chart showed a downtrend with my first hit @ 123.30 area then 122.65, to122.20, but with everything on the table I think a Long is a safe bet, What are yout thoughts? I would like to thank Cohiba Pips, Mpt,and PipPipPip, and all the other traders who research the trends. Thank You !
 
 
  • Post #2,732
  • Quote
  • Edited Sep 7, 2011 12:57am Sep 6, 2011 11:15pm | Edited Sep 7, 2011 12:57am
  •  Mpt
  • Joined Nov 2009 | Status: Member | 2,582 Posts
Quoting trumpet
Disliked
Early today I was on a wild ride like the rest of you, after research and the imput from other traders, I am closeing my shorts, I think it is highly likely the Yen will follow suit with the Swiss, I have been tradeing since 2005 and I have never seen a market like this, I always use a Min. stop loss of 100 Pips with nthis pair, I think its time to make it larger! Mt chart showed a downtrend with my first hit @ 123.30 area then 122.65, to122.20, but with everything on the table I think a Long is a safe bet, What are yout thoughts? I would like to...
Ignored

GJ travelled past a double bottom and had a good rejection from that long term lower trend line. What I found particularly interesting was that, upon release of the SNB news, GJ flew out of its downwards facing triangle formation, but eventually came back to it again.

On the topic of the Japanese emulating the Swiss, maybe they will, maybe they won't. But I do get the impression that the USDJPY in particular has formed a "rounded bottom" formation, so it may not be bearish from now on. But the other part of GJ is the Pound.

The daily chart below may end up being absolute rubbish, but it might show a turning point for GU as well:

Attached Image (click to enlarge)
Click to Enlarge

Name: gu daily.gif
Size: 29 KB
 
 
  • Post #2,733
  • Quote
  • Sep 7, 2011 12:56am Sep 7, 2011 12:56am
  •  Mpt
  • Joined Nov 2009 | Status: Member | 2,582 Posts
Another GJ trading 101 chart. Waiting for confirmed breakout from the triangle:


Attached Image (click to enlarge)
Click to Enlarge

Name: gjwave.gif
Size: 30 KB
 
 
  • Post #2,734
  • Quote
  • Sep 7, 2011 2:28am Sep 7, 2011 2:28am
  •  riko2705
  • | Joined Aug 2009 | Status: Member | 781 Posts
Quoting Mpt
Disliked
GJ travelled past a double bottom and had a good rejection from that long term lower trend line. What I found particularly interesting was that, upon release of the SNB news, GJ flew out of its downwards facing triangle formation, but eventually came back to it again.

On the topic of the Japanese emulating the Swiss, maybe they will, maybe they won't. But I do get the impression that the USDJPY in particular has formed a "rounded bottom" formation, so it may not be bearish from now on. But the other part of GJ is the Pound.

The daily...
Ignored
thanks mpt if asc tl holds ı think the same.if not longs like me burn:-)
good trading
 
 
  • Post #2,735
  • Quote
  • Sep 7, 2011 3:59am Sep 7, 2011 3:59am
  •  riko2705
  • | Joined Aug 2009 | Status: Member | 781 Posts
lets see if a morning doji star would build on TL..
good trading to all
Attached Images (click to enlarge)
Click to Enlarge

Name: ms.png
Size: 31 KB Click to Enlarge

Name: dınx.png
Size: 14 KB
 
 
  • Post #2,736
  • Quote
  • Sep 7, 2011 9:50pm Sep 7, 2011 9:50pm
  •  Mpt
  • Joined Nov 2009 | Status: Member | 2,582 Posts
Just thought I would point out these stories just published on forexlive, for what they're worth.


http://www.forexlive.com/blog/2011/0...hifted-higher/

http://www.forexlive.com/blog/2011/0...-this-weekend/
 
 
  • Post #2,737
  • Quote
  • Sep 8, 2011 2:20am Sep 8, 2011 2:20am
  •  stblazer
  • | Joined Sep 2011 | Status: Junior Member | 2 Posts
It's looking like the prime time to get in on the action. Going long with everyone else at 123.40. GL everyone!
 
 
  • Post #2,738
  • Quote
  • Sep 12, 2011 5:57am Sep 12, 2011 5:57am
  •  Mpt
  • Joined Nov 2009 | Status: Member | 2,582 Posts
GJ daily

Attached Image (click to enlarge)
Click to Enlarge

Name: gj.jpg
Size: 88 KB
 
 
  • Post #2,739
  • Quote
  • Sep 12, 2011 12:44pm Sep 12, 2011 12:44pm
  •  Jackthepiper
  • | Joined Oct 2010 | Status: Member | 219 Posts
Support on 4hr established around 1.5800 from july low... bought off the second rejection in the zone at 1.58 sl: 50pips dont have a tp: 1.660 if we're shooting for the stars...

Should it rally to around today's high ~1.5875 and stall i'll move sl to b.e in case the bear move continues...
Attached Images (click to enlarge)
Click to Enlarge

Name: no1.GIF
Size: 91 KB Click to Enlarge

Name: no2.GIF
Size: 70 KB
 
 
  • Post #2,740
  • Quote
  • Sep 12, 2011 4:02pm Sep 12, 2011 4:02pm
  •  cohiba pips
  • | Joined Nov 2007 | Status: Member | 1,839 Posts
Quoting Jackthepiper
Disliked
Support on 4hr established around 1.5800 from july low... bought off the second rejection in the zone at 1.58 sl: 50pips dont have a tp: 1.660 if we're shooting for the stars...

Should it rally to around today's high ~1.5875 and stall i'll move sl to b.e in case the bear move continues...
Ignored
are on the right track but your tp is very unreal rather sell the rallies from this point but its going to be scrappy for a few days maybe weeks
Attached Image (click to enlarge)
Click to Enlarge

Name: gu daily 120911.gif
Size: 23 KB
 
 
  • Interactive Trading
  • /
  • GBP/JPY, GBP/USD, and EUR/USD (technical analysis)
  • Reply to Thread
    • 1 135136Page 137138139 155
    • 1 Page 137 155
0 traders viewing now
  • More
Top of Page
Forex Factory Blog Updated: Alerting All Members
  • Facebook
  • Twitter
About FF
  • Mission
  • Products
  • User Guide
  • Media Kit
  • Blog
  • Contact
FF Products
  • Forums
  • Trades
  • Calendar
  • News
  • Market
  • Brokers
  • Trade Explorer
FF Website
  • Homepage
  • Search
  • Members
  • Report a Bug
Follow FF
  • Facebook
  • Twitter

FF Sister Sites:

  • Metals Mine
  • Energy EXCH
  • Crypto Craft

Forex Factory® is a brand of Fair Economy, Inc.

Terms of Service / ©2022