• Home
  • Forums
  • Trades
  • News
  • Calendar
  • Market
  • Brokers
  • Login
  • Join
  • User/Email: Password:
  • 10:37pm
Menu
  • Forums
  • Trades
  • News
  • Calendar
  • Market
  • Brokers
  • Login
  • Join
  • 10:37pm
Sister Sites
  • Metals Mine
  • Energy EXCH
  • Crypto Craft

Options

Bookmark Thread

First Page First Unread Last Page Last Post

Printable Version

Similar Threads

Demark Sequential 9 replies

TD Sequential Indicator 6 replies

TD Sequential Questions 2 replies

Help add Alert to TD sequential indicator? 4 replies

Charting packages that have TD sequential 3 replies

  • Interactive Trading
  • /
  • Reply to Thread
  • Subscribe
  • 158
Attachments: TD Sequential counts Trading & analysis
Exit Attachments

TD Sequential counts Trading & analysis

  • Last Post
  •  
  • 1 45678 Page 9
  • 1 678 Page 9
  •  
  • Post #161
  • Quote
  • Jun 24, 2011 7:37am Jun 24, 2011 7:37am
  •  Ict
  • | Commercial Member | Joined Mar 2011 | 16 Posts
Has anyone experienced consistent results applying this method?
  • Post #162
  • Quote
  • Jun 29, 2011 4:11am Jun 29, 2011 4:11am
  •  fontu
  • Joined Mar 2008 | Status: Name real with real own way | 16,418 Posts
Quoting Ict
Disliked
Has anyone experienced consistent results applying this method?
Ignored
I do not anybody using it or any much interest but myself use to see as a background skeleton & present intention and trade without any indicator actually . so not know how contribution to any success trades for tdsc.many interest in it can update with regular success failures to judge possible .Anyway it it very good to use to see the market as a whole .
thanks ,
fontu
  • Post #163
  • Quote
  • Jun 29, 2011 5:01am Jun 29, 2011 5:01am
  •  simpleguy
  • Joined Jan 2008 | Status: Member | 516 Posts
Quoting fontu
Disliked
I do not anybody using it or any much interest but myself use to see as a background skeleton & present intention and trade without any indicator actually . so not know how contribution to any success trades for tdsc.many interest in it can update with regular success failures to judge possible .Anyway it it very good to use to see the market as a whole .
thanks ,
fontu
Ignored
I know of 2 professional groups that are using this across different markets. They have found very good success using it on different time frames as a MTF type of a tool to help with the timing. It's not a stand alone, but being used as an indicator/filter to keep your eyes on, it signals when something may be happening. people from both groups have told me it has saved and made them capital they normally would not have made.

I do know that both groups also use the CQG trading platform and they will tell me if that platform has made any modifications to the code, damm proprietary trade secretes. The one thing I got from them is that they have what to me sounds like a dash board that will show several of the Demark indicators across the time frames.

Fun guys to chat with after a few drinks. Spent about $50 on booze on the one guy and what he taught me that night has more than made it back.
A woman drove me to drink, and I forgot to thank her :cool:
  • Post #164
  • Quote
  • Jul 22, 2011 1:18pm Jul 22, 2011 1:18pm
  •  Togu
  • | Joined Jan 2008 | Status: Member | 549 Posts
So this method basically sees the market as a whole? What about recent PAs?
After seeing those numbers I may think of another basic math or averaging down the historical prices. In the first page I've found pdf which stated it hits 70%. Fontu you've been trading this for over a year now. Can you tell us if it really works? So this might be a good way to catch a trend reversal. Is this scalp trading or it can be traded in longer terms? How about risk reward ratio? I trade with methodology of 1:2 risk reward ratio.
Thanks
  • Post #165
  • Quote
  • Edited Jul 24, 2011 1:28am Jul 23, 2011 2:25pm | Edited Jul 24, 2011 1:28am
  •  fontu
  • Joined Mar 2008 | Status: Name real with real own way | 16,418 Posts
Quoting Togu
Disliked
So this method basically sees the market as a whole? What about recent PAs?
After seeing those numbers I may think of another basic math or averaging down the historical prices. In the first page I've found pdf which stated it hits 70%. Fontu you've been trading this for over a year now. Can you tell us if it really works? So this might be a good way to catch a trend reversal. Is this scalp trading or it can be traded in longer terms? How about risk reward ratio? I trade with methodology of 1:2 risk reward ratio.
Thanks
Ignored
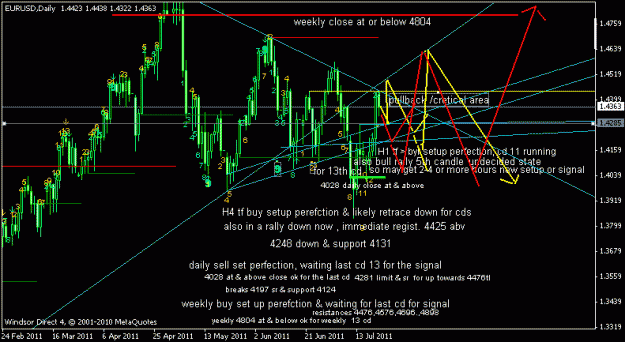
Thanks for the interest , yes I think one of the most reliable system see the market with reliable pa & rr 1;2 ok to me too . yes specially used for reversal trend & can be used for & actually for long term trades . but myself doing mostly day trading only using it & price action at present time with or without help of it and take care about what it signals .

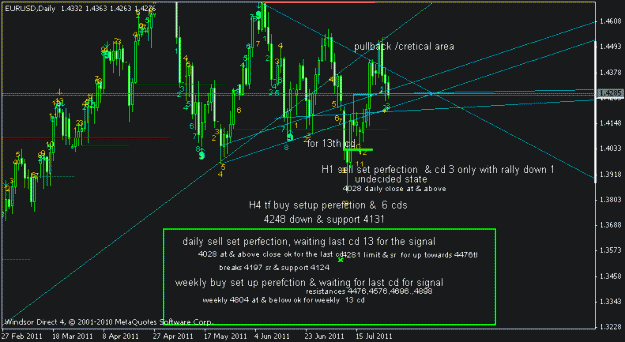
present pa purely on tdsc as in the chart now . H1 & H4 tf buy set up likely act first & to accomplish daily one & last weekly. 4280 limit level is the present most important level of interest wavewise.

other analysis here

http://www.forexfactory.com/showthre...95#post4803895

for next week

http://www.forexfactory.com/showthre...47#post4803847


Thanks , fontu
Attached Image (click to enlarge)
Click to Enlarge

Name: eu.gif
Size: 20 KB
  • Post #166
  • Quote
  • Jul 29, 2011 3:06am Jul 29, 2011 3:06am
  •  fontu
  • Joined Mar 2008 | Status: Name real with real own way | 16,418 Posts
Quoting fontu
Disliked
Thanks for the interest , yes I think one of the most reliable system see the market with reliable pa & rr 1;2 ok to me too . yes specially used for reversal trend & can be used for & actually for long term trades . but myself doing mostly day trading only using it & price action at present time with or without help of it and take care about what it signals .

present pa purely on tdsc as in the chart now . H1 & H4 tf buy set up likely act first & to accomplish daily one & last weekly. 4280 limit level is the present most important level of interest...
Ignored

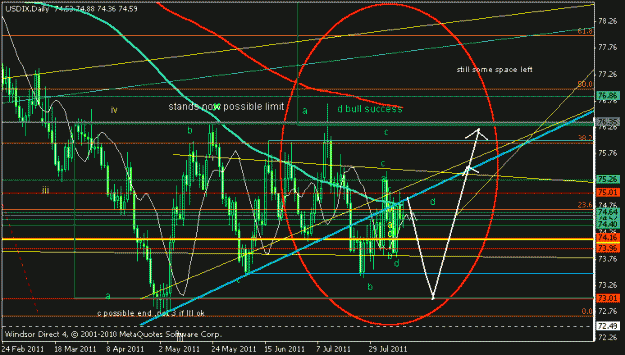
update , progress ok , following yellow lines & now towards daily close 4028 , & lower sr to act before up if.

fontu
Attached Image (click to enlarge)
Click to Enlarge

Name: gu2.gif
Size: 16 KB
  • Post #167
  • Quote
  • Edited at 3:43pm Aug 13, 2011 3:17pm | Edited at 3:43pm
  •  fontu
  • Joined Mar 2008 | Status: Name real with real own way | 16,418 Posts
Again to check tdsc as the last week also failed to find a direction no sell signal in daily nor weekly buy signal , both perhaps being prevented .
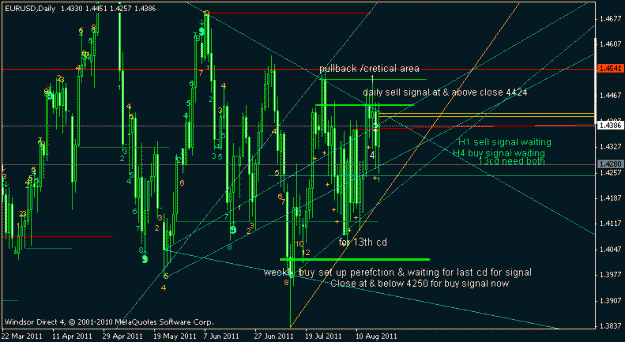
Presently both narrowed , 4373 daily close at & above should have the daily sell signal to continue up more 4437 , 4508/36 ok before real sell can occure & this level will remain for next 2 trading days . after that level for signal cd may down if unable to up enough by this time , 2 days . so ranging up more probable next 2 days specially & again few days next .

Weekly close at & below 4250 also may constinue buy signal more invasive than daily , and may stay as such for more weeks close at lower levels , much below for signal TD intersection level 4804 to constitue a stroger buy signal .


If I have the power to manipulate still what will prefer next? a less invasive at least for timebeing & allow go up for a sell signal next in favour & look for abortion of the buy signal , still may got enough time to do so.so USD may prefer tank a leg down to have more strong support to bounce .

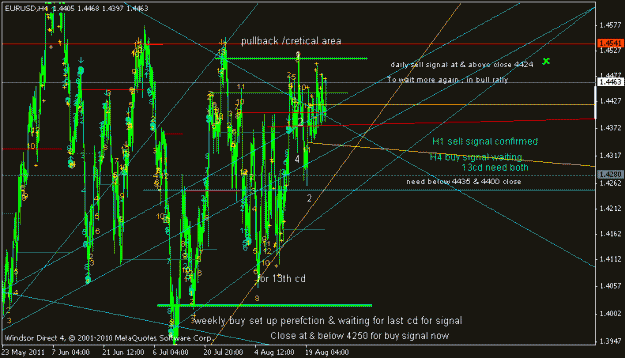
eu h4 tf also wants the sell signal & deserve it up also 4280 close & continue more up before the sell next ,next support upside 4365 & resistance here 4404 .
Note both eu & usdx in bull set up last waves but only one to survive now .Though this time is very cretical to have a direction yet immediate bais now eu bull & usdx bear as per tdsc.

fontu
Attached Images (click to enlarge)
Click to Enlarge

Name: gu2.gif
Size: 20 KB Click to Enlarge

Name: gu3.gif
Size: 18 KB
  • Post #168
  • Quote
  • Edited at 1:34pm Aug 21, 2011 11:59am | Edited at 1:34pm
  •  fontu
  • Joined Mar 2008 | Status: Name real with real own way | 16,418 Posts
The tag of war continues , no big signal daily or weekly level , still to come if possible .

H1 tf awaiting sell signal , need 13th cd at & above next close 4394/4402 if so prompt with market open or may changed later if fail ,bounced above it's support 4227 , resistances 4412,4419 & 4426 immediately , others 4442, 4506 as the good expecting next . After the sell signal it may continue up towards the good exting one before the real sell may happen .

Next h4 also awaiting buy signal by 13th cd again for next step where it needs close at or below 4314 or 4257 , a real tough job for sure where limit stands at 4344, supports 4304,4248,4218,4202,4171. now below the resitance 4404 but above 4378.

so as per lower tf a good ranging possible again though I doubt more bear action 4344 or 4300 further . so near term outlook bullish .

In daily tf , same waiting for sell signal cd 13th , now lowerd the level 4424 at & above daily close & thereafter continue bull towards 4541-4694 before the real sell may occur.

weekly remain the same 4250 at &below close weekly for bull signal , remaining pessimistic now for it , chance should not come again & again , still possible it as seen in H4 tf & also a good sell signal in h1 if strong enough by chance .
so overall bull may play more than bear or take full controll UP. and my want give it full chance tank again for good entry. buy at any lows will be my formula next .
fontu

other analysis ok as per .+ usdx
http://www.forexfactory.com/showthre...79#post4886379

usdchf support
http://www.forexfactory.com/showthre...98#post4887698

next market to decide
Attached Images (click to enlarge)
Click to Enlarge

Name: uc.gif
Size: 19 KB Click to Enlarge

Name: uc1.gif
Size: 10 KB Click to Enlarge

Name: uc2.gif
Size: 11 KB
  • Post #169
  • Quote
  • Aug 25, 2011 3:44am Aug 25, 2011 3:44am
  •  fontu
  • Joined Mar 2008 | Status: Name real with real own way | 16,418 Posts
Update eu , H1 sell signal sitting now & H4 buy one waiting , daily sell signal delayed & weekly awaiting .
fontu
Attached Image (click to enlarge)
Click to Enlarge

Name: usd1.gif
Size: 22 KB
  • Post #170
  • Quote
  • Aug 27, 2011 11:39am Aug 27, 2011 11:39am
  •  fontu
  • Joined Mar 2008 | Status: Name real with real own way | 16,418 Posts
http://www.forexfactory.com/showthre...72#post4907472

http://www.forexfactory.com/showthre...11#post4906711

fontu
  • Post #171
  • Quote
  • Sep 4, 2011 1:32am Sep 4, 2011 1:32am
  •  fontu
  • Joined Mar 2008 | Status: Name real with real own way | 16,418 Posts
Next week views , may to go alone here .other analyses also there . lets see

http://www.forexfactory.com/showthre...29#post4925729
fontu
  • Post #172
  • Quote
  • Jul 14, 2013 2:28pm Jul 14, 2013 2:28pm
  •  pat16
  • | Joined Oct 2012 | Status: Member | 7 Posts
The back test of the TD Sequential (all 4 market groups; data since 1980): http://www.oxfordstrat.com/trading-s...-sequential-1/

http://www.oxfordstrat.com/wp-conten...al-2/pf-3d.png
  • View Post
  • Hidden for breach of Trader Code of Conduct
  • butcherfx
  • Interactive Trading
  • /
  • TD Sequential counts Trading & analysis
  • Reply to Thread
    • 1 45678 Page 9
    • 1 678 Page 9
0 traders viewing now
Top of Page
  • Facebook
  • Twitter
About FF
  • Mission
  • Products
  • User Guide
  • Media Kit
  • Blog
  • Contact
FF Products
  • Forums
  • Trades
  • Calendar
  • News
  • Market
  • Brokers
  • Trade Explorer
FF Website
  • Homepage
  • Search
  • Members
  • Report a Bug
Follow FF
  • Facebook
  • Twitter

FF Sister Sites:

  • Metals Mine
  • Energy EXCH
  • Crypto Craft

Forex Factory® is a brand of Fair Economy, Inc.

Terms of Service / ©2021