Financial Markets Observatory Lab.
Some indicators of Financial Stress.
The following charts shows some special spreads of ISM Non-Manufacturing (see previous posts on these indicator types).
The possible benchmarks are (charts & notes):
ISI; IWV; IYY; TMW.
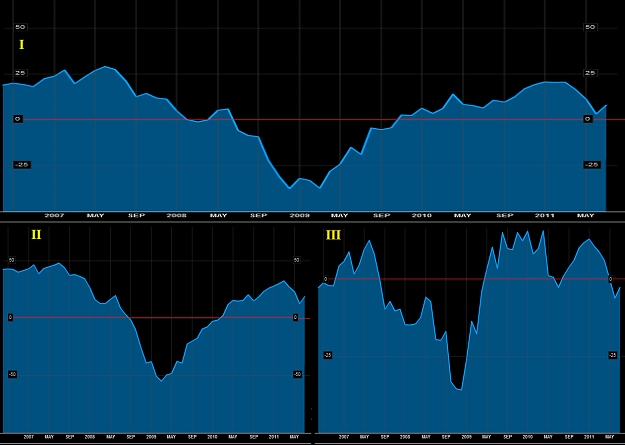
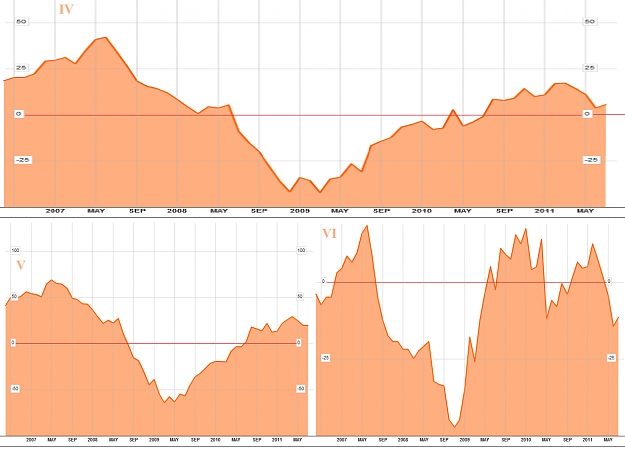
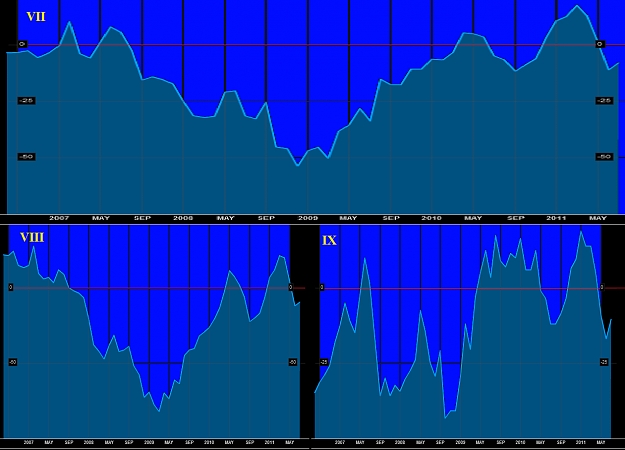
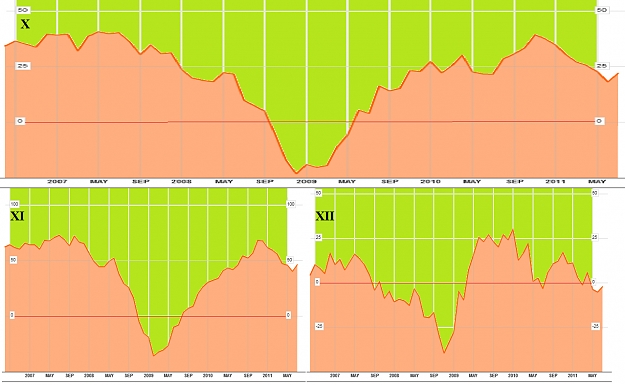
In the chart I there is the spread between ISM Non-manufacturing Prices Index vs. Business Activity Index (contrarian to underlying).
In the chart II and III there are the inventory spreads as follows: II) Inventory Index vs. New Orders Index; III) Inventory Sentiment Index vs. Inventory Index (about contrarians to underlying).
Notes about stress
According to the chart I the financial stress shows a big increases during 2011 with in-line top vs. 2003 and 2007; moreover we can see an important divergence between indicator lows 2009/2010/2011 vs. underlying tops.
The chart II shows an imperfect double low 2010/2011 and a monster top during 2011 above previous tops exc. 2001 and 2009 !!!
Chart III do not confirm high stress increases but only an importat divergence in 2010/2011 lows.
There are some alert signs from ISM indicators.
https://research.stlouisfed.org/fred...graph_id=51035
https://research.stlouisfed.org/fred...graph_id=51033
https://research.stlouisfed.org/fred...graph_id=51034
☻/ Alert on the stress.
/▌
/|
Tuned on main trend, and follows short-medium term signs from underlying prices, for a real-time and correct set-up.
It is very important do not anticipate the main trend of the underlying financial instruments.
K€SADDhAPHA'pe'KAMPA' €MP¥R€ K€$☂ €§§-$0UND $¥$T€M$ ❣❣❣
ⒾⓂⓄ ℬϒ $@❣♆¥ ❣❣❣ ♥ █║▌│█│║▌║▌║| █  ❤
❤
۞
H! ALL [ bad English, sorry ⊱ : ( ]Some indicators of Financial Stress.
The following charts shows some special spreads of ISM Non-Manufacturing (see previous posts on these indicator types).
The possible benchmarks are (charts & notes):
ISI; IWV; IYY; TMW.
In the chart I there is the spread between ISM Non-manufacturing Prices Index vs. Business Activity Index (contrarian to underlying).
In the chart II and III there are the inventory spreads as follows: II) Inventory Index vs. New Orders Index; III) Inventory Sentiment Index vs. Inventory Index (about contrarians to underlying).
Notes about stress
According to the chart I the financial stress shows a big increases during 2011 with in-line top vs. 2003 and 2007; moreover we can see an important divergence between indicator lows 2009/2010/2011 vs. underlying tops.
The chart II shows an imperfect double low 2010/2011 and a monster top during 2011 above previous tops exc. 2001 and 2009 !!!
Chart III do not confirm high stress increases but only an importat divergence in 2010/2011 lows.
There are some alert signs from ISM indicators.
https://research.stlouisfed.org/fred...graph_id=51035
https://research.stlouisfed.org/fred...graph_id=51033
https://research.stlouisfed.org/fred...graph_id=51034
☻/ Alert on the stress.
/▌
/|
Tuned on main trend, and follows short-medium term signs from underlying prices, for a real-time and correct set-up.
It is very important do not anticipate the main trend of the underlying financial instruments.
K€SADDhAPHA'pe'KAMPA' €MP¥R€ K€$☂
ⒾⓂⓄ ℬϒ $@❣♆¥ ❣❣❣ ♥