EUR/JPY
Attached Image

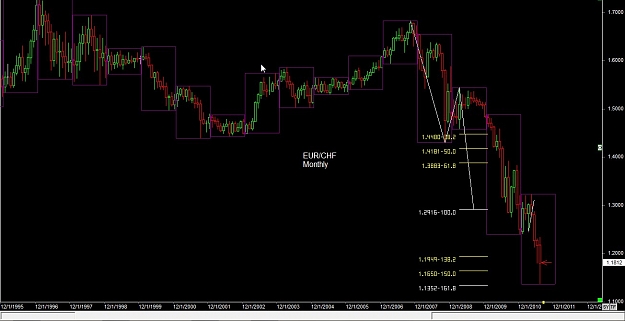
Monthly chart shows some large level retracement levels;red line is a part of the downtrend, while the green line is part of an uptrend.
Attached Image (click to enlarge)

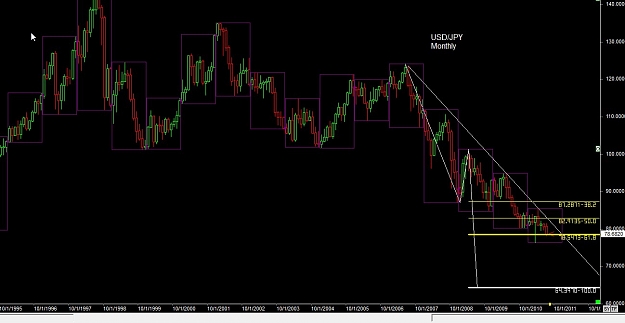
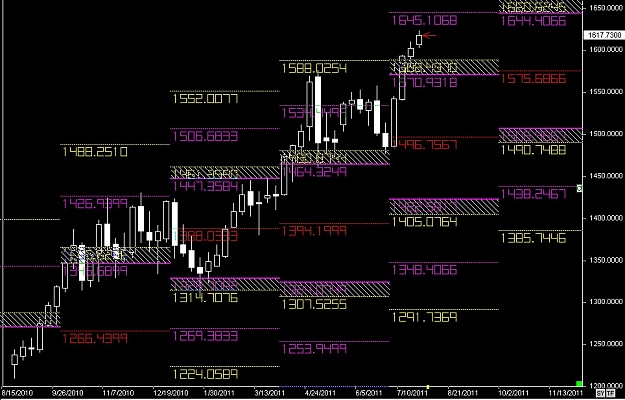
Daily chart has previous monthly levels. If a level is broke you can use the monthly levels as targets. But nothing goes straight to another monthly target, so use smaller time frame levels to work toward the target.
Remember, we cannot tell the market where to go...which is why we protect ourselves during a trade. Once the trade is going in your direction, you can find a point to move your stop just ahead of the entry. This way your entry is protected and even if the market has a strong move, you're protected. Likewise, as the market move in your favor, move your stop loss to protect your profits. This takes a little practice to maximize your pip protection and pip profit.
Attached Image (click to enlarge)

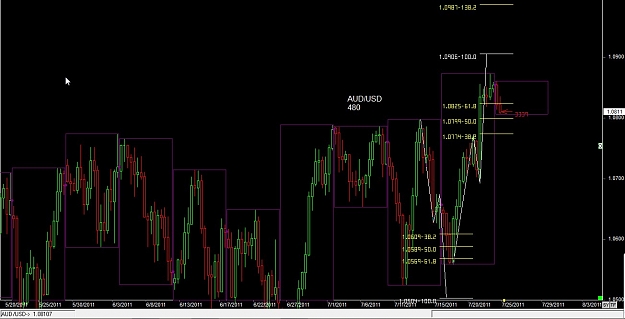
If we get our targets in the larger time frames, we need to take that trade from a smaller candle, use the 240 candle. In this chart you will see some of the monthly levels. You can also see two of the swings have Fibonacci exp. on them.
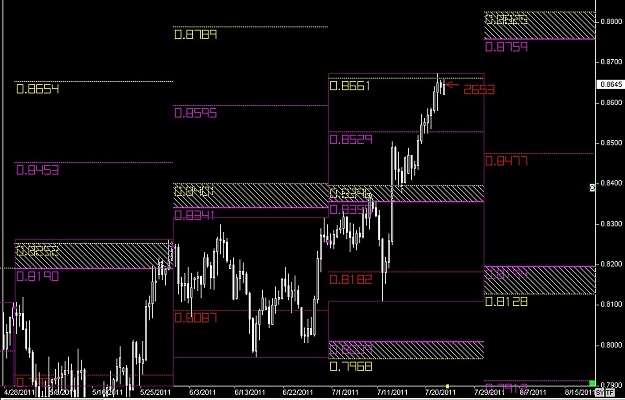
I'll be watching for an open above/below 112.71
Attached Image (click to enlarge)

Dan