I've applied the colour MA to the chart and it's nowhere near as clear cut and easy to use. I may have to think again about this.
Ignored
Maybe you should give MACD histogram a try. It very clearly shows whether MAs converge or diverge (and there are custom MACDs, which show it in color) and cross.
I use such an entry confirmation as a part of a system that I am currently testing. I can attach a screenshot if you want (I do not want to litter your thread).
Very interesting.... how would you handle news? With a SL 30 you might get taken out on a news spike unless you're nicely in profit.
Looks like this might lend itself to an EA for backtesting purposes.
Nice find.
Ignored
The standard answer to that one is not to trade 30 mins either side of the news announcement. Of course unexpected events can't be avoided but stop losses are there for that reason.
In terms of an ea I don't know, I don't use them but feel free if you know how to code?
I've applied the colour MA to the chart and it's nowhere near as clear cut and easy to use. I may have to think again about this.
Ignored
All it is is a pullback system.
On a long, price has to be above the 150 lwma. So trendlord 150 is blue. Now we wait for it to pullback (and in trendlord case actually Close below the 5 lwma). Once price Close Above the 5 lwma the 5 Trendlord turns blue and you enter the trade.
You don't need Trendlord, you don't even need the color MAs. You just need the LWMAs plotted.
You are looking too hard at the indicators and not thinking about the logic of what is happening. Why is trendlord changing color etc.
He puts a delay in the coloring of the indicator by taking a LWMA of the LWMA. So he has a LWMA at 150 and then he puts a LWMA 12 on that. When the slope changes on the 2nd LWMA then the Trendlord changes color. How is the 2nd LWMA period calculated. It is just the squareroot of the previous LWMA period. Nothing magical. Just a number pulled out of nowhere.
Is the delay helpful? Perhaps, it may lessen whipsaws. others may think that it gets you in too late.
But the fundamental logic is a 5-150 pullback. There are a lot of pullback strategies. They work well at their core. They are simple to understand and combined with HH, HL type concepts they can be very profitable.
I don't mean to rain on your parade and if that is how this is coming across then i apologize in advance.
Maybe you should give MACD histogram a try. It very clearly shows whether MAs converge or diverge (and there are custom MACDs, which show it in color) and cross.
I use such an entry confirmation as a part of a system that I am currently testing. I can attach a screenshot if you want (I do not want to litter your thread).
Ignored
I think I have tried something like this before and it hasn't worked as well. Obviously now we know that the trendlord indicator repaints horribly that tells us why it looked so good in visual backtesting!
Maybe I will have a look at some different settings for MACD and also maybe OSMA which I believe is slightly different?
I plucked 40 pips from eurusd today anyway, that down move is only just starting to go sideways now. There was a lot more there to be had but there were trendlines and the 1.41 level there so I took a small profit for a small risk.
On a long, price has to be above the 150 lwma. So trendlord 150 is blue. Now we wait for it to pullback (and in trendlord case actually Close below the 5 lwma). Once price Close Above the 5 lwma the 5 Trendlord turns blue and you enter the trade.
You don't need Trendlord, you don't even need the color MAs. You just need the LWMAs plotted.
You are looking too hard at the indicators and not thinking about the logic of what is happening. Why is trendlord changing color etc.
He puts a delay in the coloring of...
Ignored
All points taken and all feedback welcome.
I will look into your points and see if I can come up with something workable.
Be nice to have the exact MAs plugged onto the chart in that case but the 150 and 5 do not give exactly the same thing ?
How can we plug a LWA of a LWA ?
Somebody would have a ex4 of it ?
Thanks
zaba1
Be nice to have the exact MAs plugged onto the chart in that case but the 150 and 5 do not give exactly the same thing ?
How can we plug a LWA of a LWA ?
Somebody would have a ex4 of it ?
Thanks
zaba1
Ignored
Put on the 150 LWMA on Close. Then put on the 12 LWMA on Previous Indicators Data.
The 12 is squareroot of 150 (actually 12.2 but need an integer)
Thanks but not sure how to do so in practice ....
How about the 5 ?
Thanks for your help
zaba1
Ignored
Zaba1,
I just made this template for you.
Again, you would put a 150 LWMA on Close and then put 12 LWMA on Previous Indicators data. Then the 5 LWMA on Close and then the 2 LWMA on Previous Indicators data.
Now you would make the color of the 150 and the 5 as None (so you cannot see them)
I am NOT suggesting that you trade this. I am only providing the template so you can see how it is done.
I've had a play around with a chart and to be honest I think I'm better off just trading it the way I was doing. Big round number s/r, local s/r, trendlines and stochastics. When the stochs cross in the direction of the overall trend and in the OB/OS area and you are not trading into strong s/r then take the trade. The cross and or confirming PA must occur somewhere near a s/r level like a trendline. Don't lose too much when you lose, 20 to 30 pips, stay in until the stochs move up/down against the trend, usually good for 60 to 120 pips.
The key is to use price action at support and resistance, trade with the trend and keep your losses small. I'm sure I'm the first person to ever think of that
Anyway I think it was a good original idea at the start of the thread but with the repainting problem and nothing else so clear and easy to understand I think I'll call it a day.
By having a trendlord set à 5 and another at 150, what you are doing is equivalent at looking at trendlord set at 5 on a higher timeframe for direction and pick entry from trendlord set at 5 on shorter timeframe. I'LL give you an example.
If you open a daily chart with trendlord set à 5, then you open a 1 hour chart with trendlord also set at 5. You pick direction from the daily chart and take entry that goes along on the 5 minutes chart. Now if I want to do the same thing but using only one chart, on the 1 hour chart, I add a seond trendlord, but this one set at 120. Why 120 ? There is 24 hour in a day, I multiply 5 by 24, so the switch direction signal of the trendlord set à 120 on the 5 minutes would be very close to the switch direction of the trendlord set at 5 on the daily chart.
Now the beauty of this, it is that you can apply it to other indicator as well, MACD, MA's etc... By using another indicator you'll fix the repaint problem...
By having a trendlord set à 5 and another at 150, what you are doing is equivalent at looking at trendlord set at 5 on a higher timeframe for direction and pick entry from trendlord set at 5 on shorter timeframe. I'LL give you an example.
If you open a daily chart with trendlord set à 5, then you open a 1 hour chart with trendlord also set at 5. You pick direction from the daily chart and take entry that goes along on the 5 minutes chart. Now if I want to do the same thing but using only one chart, on the 1 hour chart, I add a seond trendlord,...
Ignored
Thanks, I see the logic. I'm thinking about some other indicators but as I said in my above post if I can make money trading it without (or with not many indicators) then why not just do that?
I did think the trendlord system would be nice and easy to follow and take all the guesswork out of the trades but with the repaint issue it's dead and I'm not so committed to indicators that I'm that bothered about finding others that may or may not work.
Well, I'm not suggesting that you should start to chase an indicator to replace it.
But I see that you are already using stochastic, mayby you could try with it. Alexander Elder, who wrote Trading for a living suggest to pick direction on timeframe 6 yimes higher than the one used for entry. So for entry on hour, just try using a second stochastic with settings multiplied by 6, you like it fine, else forget it.
An indicator is calculated from price, so it is always lagging. People try to make new indicator that lag as less as possible, many times they obtain indicators that repaints. So they uses it like that, because maybe they understand their limits because they thought of it, they made it.
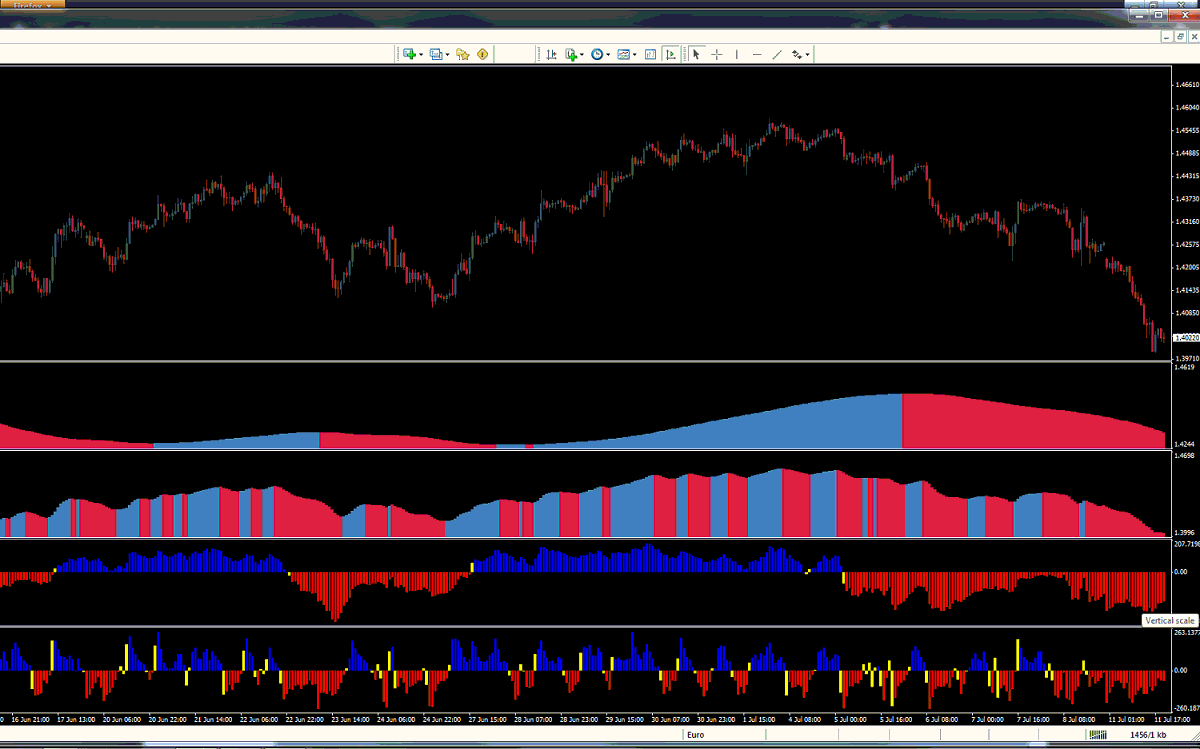
I attached an indicator, I tried it at 5 and 8, and it seems to be decent. I also attached a pictured showing your trendlord at 150, underneat at 5. And then retracement finder at 63, and underneat at 8, so you can compare and judge. When retracement finder switch direction, the first line is yellow, it turns yellow wnen the bar/candle closes. So you enter at opening of the next bar. Your system is a trend follower system. There is another system called "flag trading the trend", I suggest that you read it, it might confirm your way of doing things
Well, I'm not suggesting that you should start to chase an indicator to replace it.
But I see that you are already using stochastic, mayby you could try with it. Alexander Elder, who wrote Trading for a living suggest to pick direction on timeframe 6 yimes higher than the one used for entry. So for entry on hour, just try using a second stochastic with settings multiplied by 6, you like it fine, else forget it.
An indicator is calculated from price, so it is always lagging. People try to make new indicator that lag as less as possible, many...
I've had a play around with a chart and to be honest I think I'm better off just trading it the way I was doing. Big round number s/r, local s/r, trendlines and stochastics. When the stochs cross in the direction of the overall trend and in the OB/OS area and you are not trading into strong s/r then take the trade. The cross and or confirming PA must occur somewhere near a s/r level like a trendline. Don't lose too much when you lose, 20 to 30 pips, stay in until the stochs move up/down against the trend, usually good for 60 to 120 pips.
Ignored
I think that is just a whole point of the game - to find a method that works for you and that you're comfortable with.
I like stoch as a direction confirmation and I believe it may be very powerful if used properly.
The key is to use price action at support and resistance, trade with the trend and keep your losses small. I'm sure I'm the first person to ever think of that
Ignored
We all think that. We all know that. Pity that we often seem to suddenly loose that thinking and knowledge along with all common sense while in the heat of the game