DislikedHI Orbital
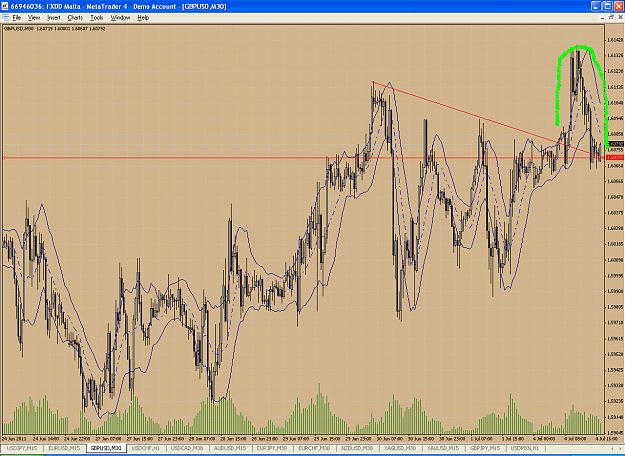
i take the volume(activity) in to my analysis as this at least to me gives me some more information ..
so EJ to me looks like its absorbing supply for the next move up ..
we are sitting at a supply area atm , and yes price gets compressed , but still holding gains .. and due to the high activity on several bars at this area .. looks like someone is absorbing most of the supply wich sits there ...
i think EJ is ready for the next move up .. still looks striong to me .. no signs of...Ignored
It would be more accurate to say .."and due to the high activity on several bars at this area .. we should watch for further confirmation of sellers"
The reason I say this is that you can see high volume and it may mean:
A) Supply is swamping demand, or vice versa
B) Supply is being absorbed by demand
Edit:
I decided to edit this post to include charts of what I mean
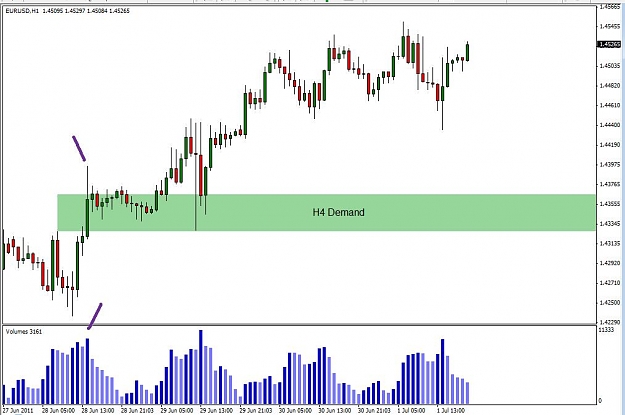
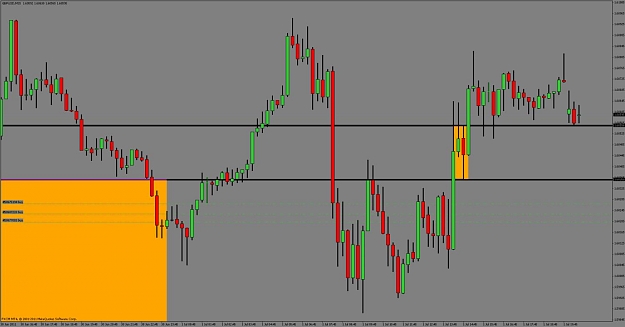
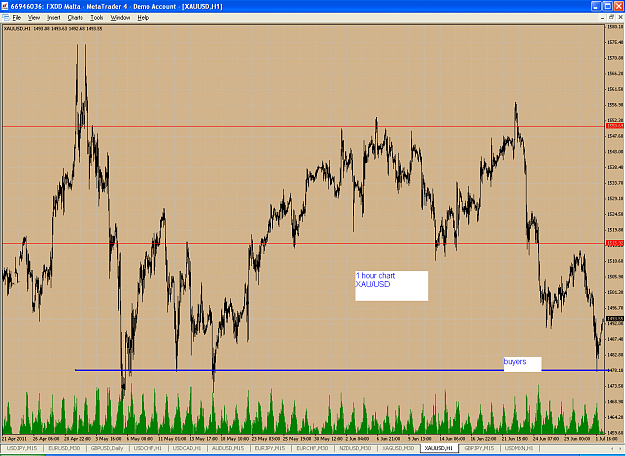
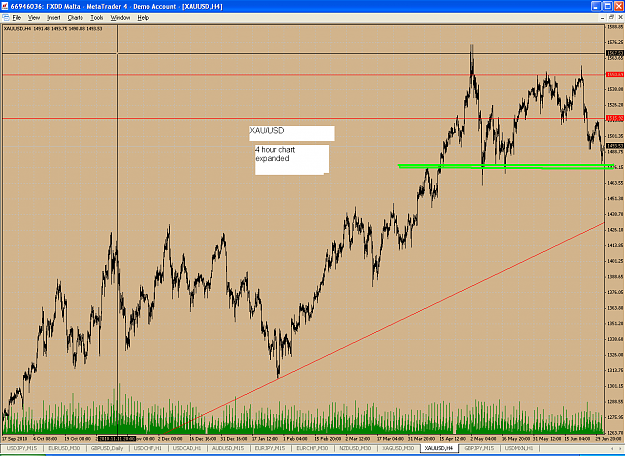
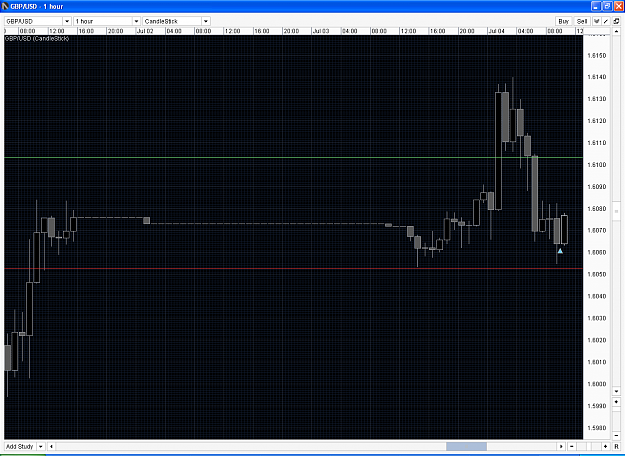
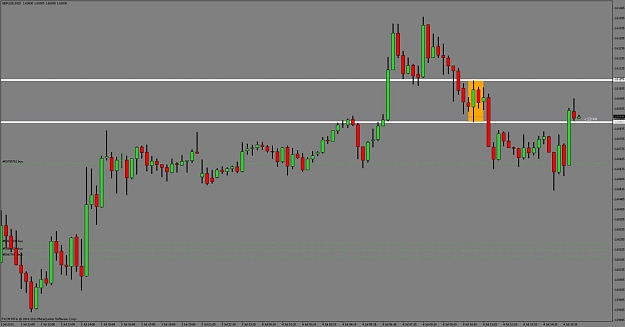
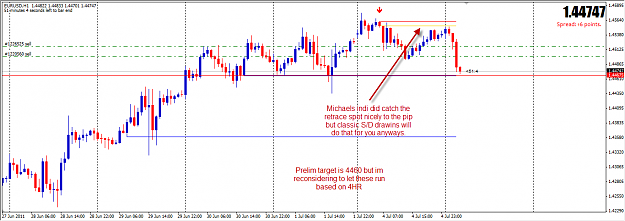
The first chart here, EU H1, shows absorption volume that is tested and proves itself to become H4 demand
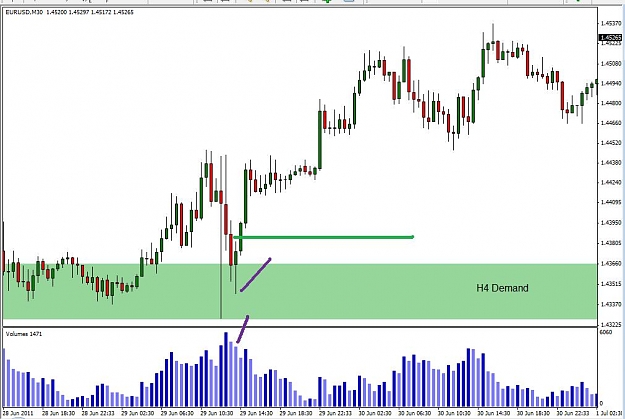
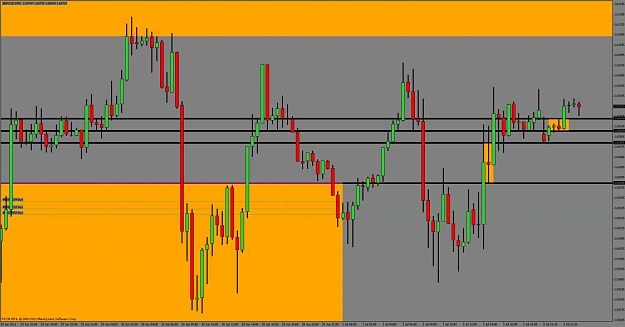
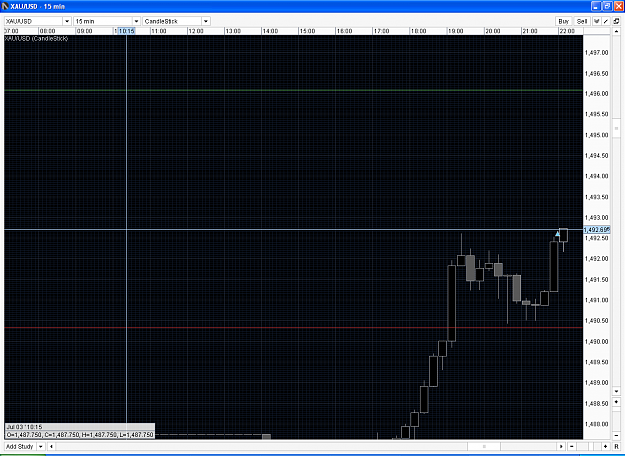
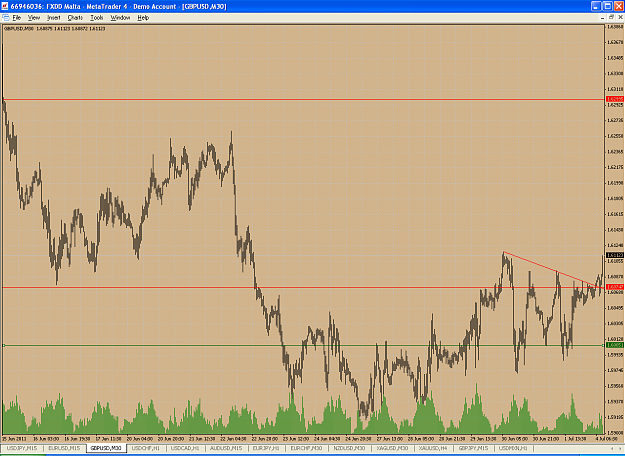
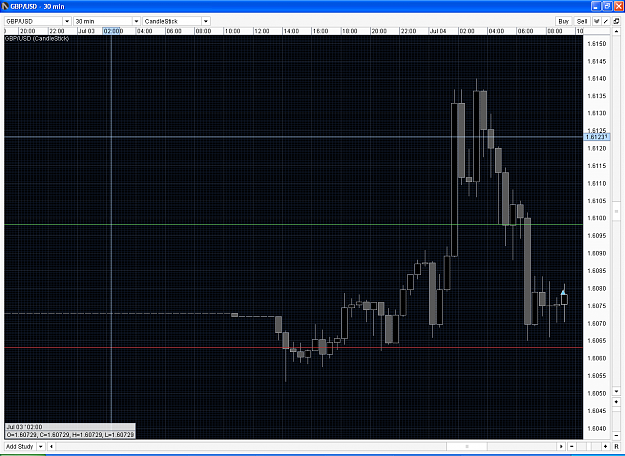
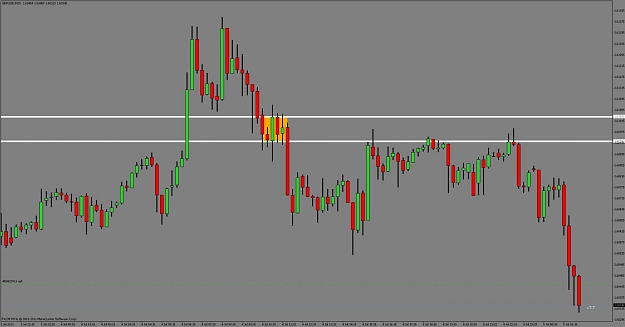
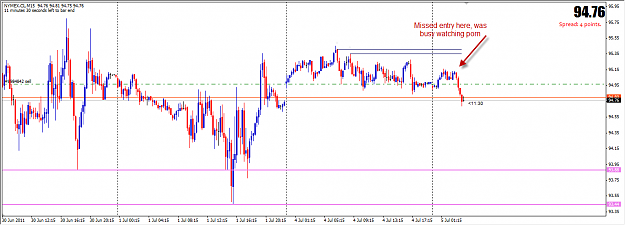
The testing is more clear on M30 chart, which is next. Following some volatility, most likely from news, this area is tested which is when a bar pokes below the previous two and has volume lesser than both of those bars. This in combination with closing on the highs is what is known as a test.
I know this thread is Price is everything, but volume can help make it surgical (if you're cool with only a couple trades per week).
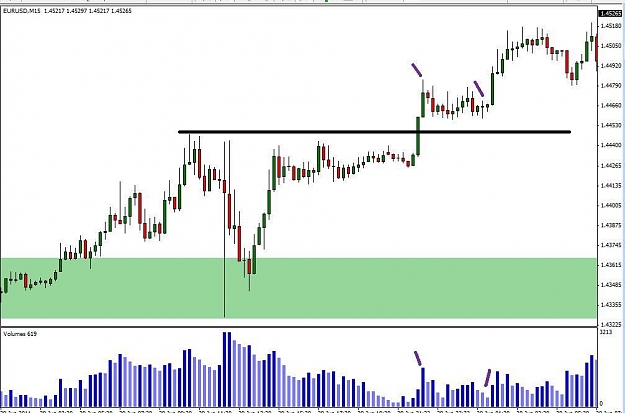
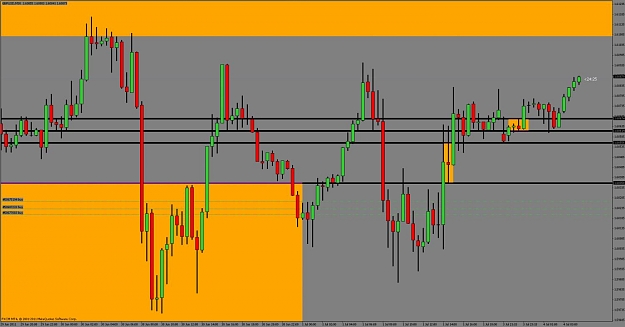
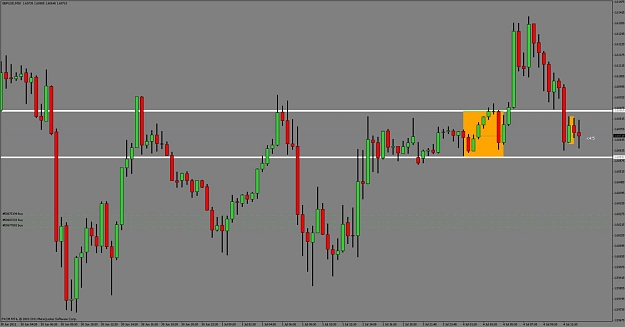
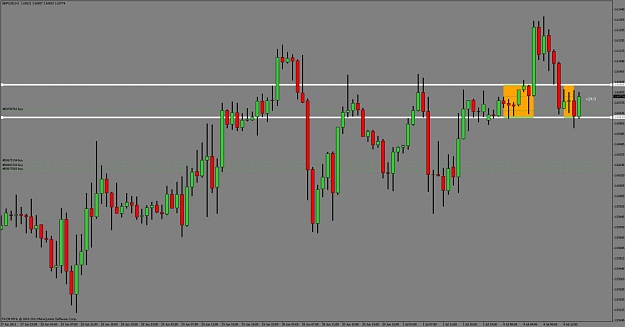
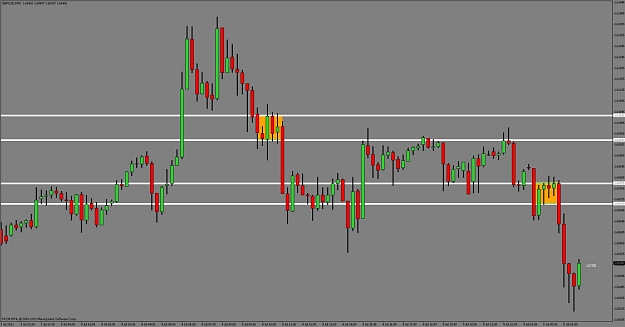
The third chart is M15 and shows supply being absorbed. You don't know that is has been absorbed during the first candle. Here you would be wary of supply swamping demand, but it becomes evident that demand has been absorbed when you see the testing. The testing is the second marked candle, and when seen in this context is a conservative entry
Edit #2:
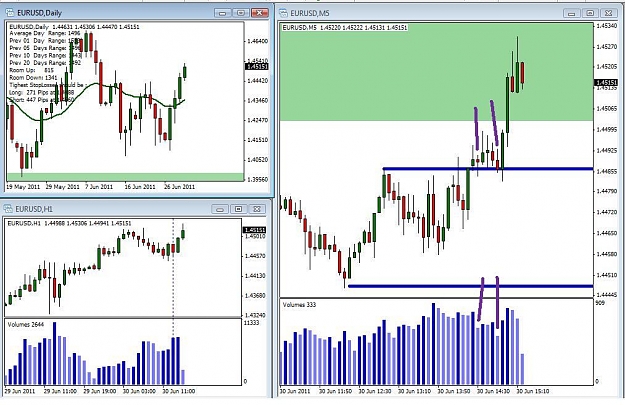
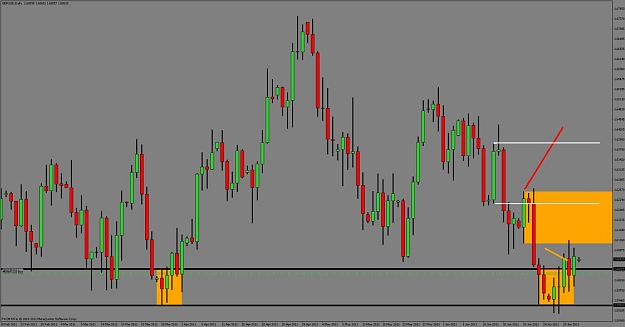
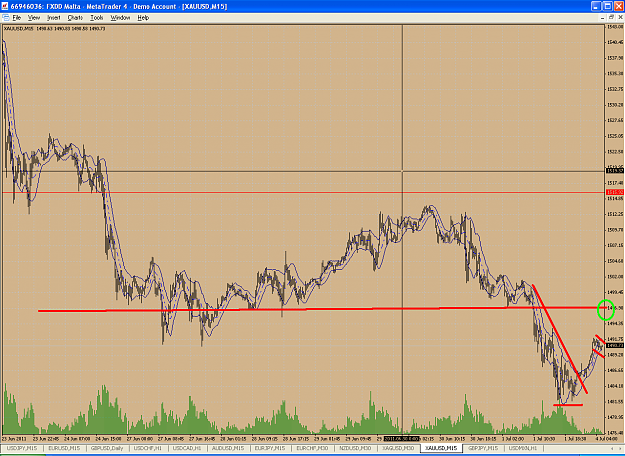
I've attached a fourth chart from my last trade of the week. This was a very aggressive trade for me, as it was a long into intermediate term demand level. The reason I went for it was that I had been observing buyers on the dips on the way up as opposed to positions being unwound which may appear as selling on the rallies towards supply.
My reasoning for entering the trade was that the current momentum was up with buying on the dips on the H1. The most recent time buyers showed their hand was on the marked H1 bar, it is marked with a faint dashed vertical line on the bottom left chart.
On the right you can see M5 breaking out of a tiny range, marked in blue. The two marked bars are my entries. These are no supply bars as they are small down bars with low volume. Low volume is volume that's less than the previous two, just like with a test, except these don't have to close on the highs.
I don't want to confuse the thread with volume talk so let me know if it is appropriate.
Attached Image(s) (click to enlarge)