I'm in this one, working out good so far.
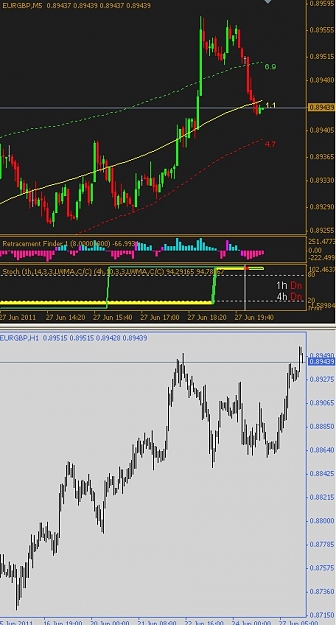
For those that are interested, how I do this is I have my "timing chart" on top and my "what's happening today" chart on the bottom (not always so zoomed in). We can see with the e/g "what's happening chart" that price just took out the high and on the "timing chart" a nice double top with both 1h and 4h ("bias helpers") showing down. I also have another screen which has daily charts so I make sure that I'm not missing anything.
(so I'm aware of the Daily but take trades based on the 1H using Kevinator as my market timing for ins and outs)
Lovin it!
Attached Image (click to enlarge)