Chantel, i was following what you mentioned on the cadjpy earlier.
Do you see any development on an entry now?
Ignored
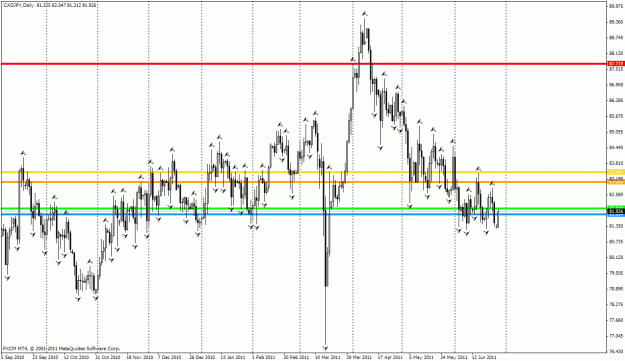
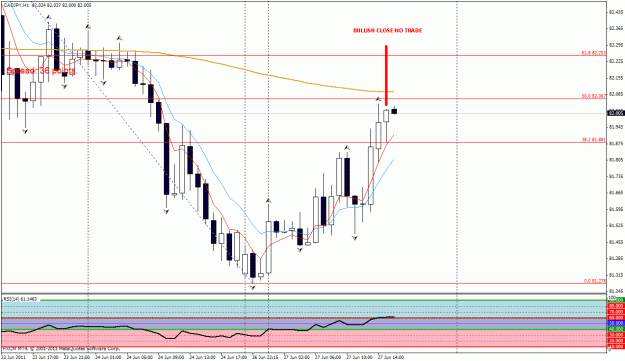
Yes I do and I will try for an entry at the top of the hour. But price is not bearish as I'd like to see... Nevertheless I am taking it unless this hour closes as a bullish one. Here are the charts... SL at D1 pivot high +10
Yes I do and I will try for an entry at the top of the hour. But price is not bearish as I'd like to see... Nevertheless I am taking it unless this hour closes as a bullish one. Here are the charts... SL at D1 pivot high +10
EDIT: Bullish close => NO TRADE
Ignored
thank you, keep us updated on your thoughts for this one
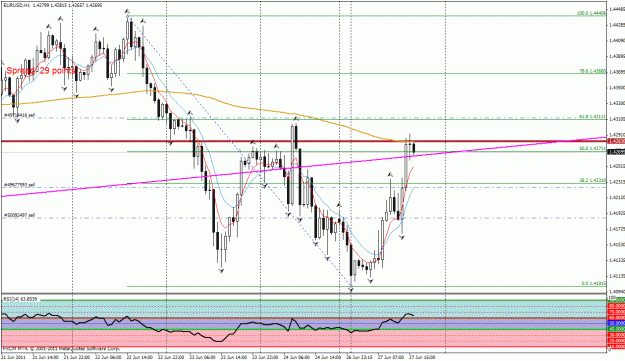
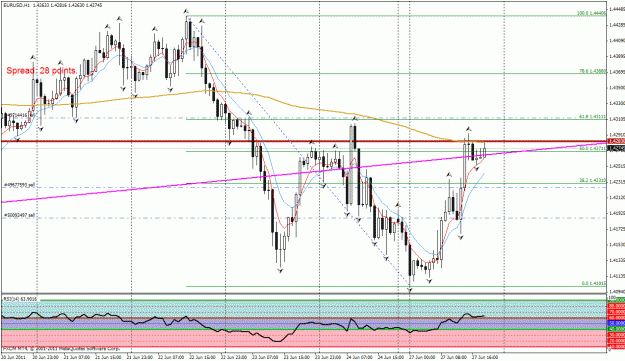
The line on the chart at 1.4283 in firebrick is last week’s midpoint i.e. the midpoint of last week’s range.
Ignored
Is the midpoint of last weeks range important for your system? I do understand S/R lines as lines of important highs and lows ... so what is your experiene with midpoints, if I may ask ?
If EU forms the bearish 1hr bar, this late in the day would you still take the short trade? I guess I should ask, how late in the trading day do you continue to take trades?
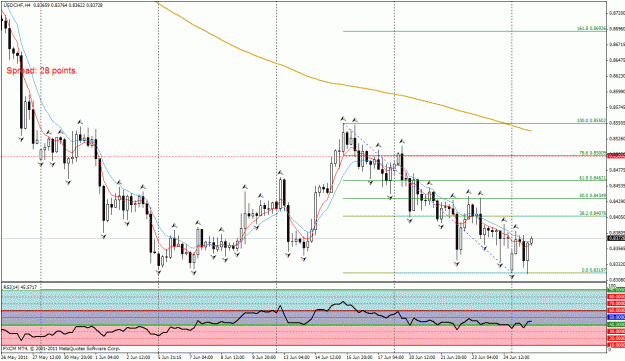
what do you think of USDCHF TF 1 H? Seems to be a pivot low, should we wait for a modest retracement ?
P.S. In the moment I wrote my posting the breakout happened ... so I think there will not develop a retracement .....
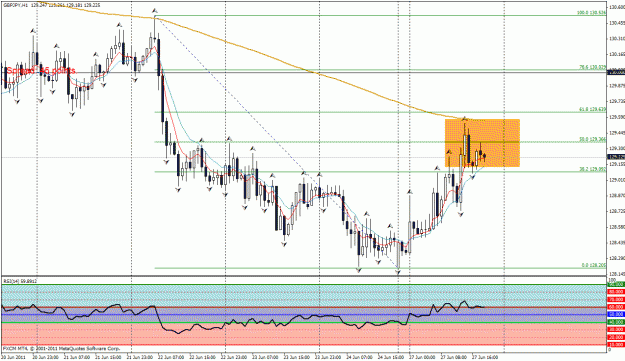
P.P.S. And I discovered that in GBPJPY 1 H is also a pivot high ... isn't it ?
Ignored
Hi, I don’t see a D1 PP there; at least I don’t have one. But what I do have is a W1 Pivot high… so until otherwise proven by D1 I stick to that…. Also don’t forget we are at the end of the month… My entries are not trading at every/any PP on H1… I enter on h1 but based on D1 & I must have a D1. On the 4hr chart I plotted for you the W1 PP
If EU forms the bearish 1hr bar, this late in the day would you still take the short trade? I guess I should ask, how late in the trading day do you continue to take trades?
thanks gmcc
Ignored
Usually I am very cautious once Europe n London are out and try not to take out of hours setups... but if a good setup presents itself and I am still working I take it.
This one does not look good on EU so I will not enter it. Will call it a day in currencies
Hi, I don’t see a D1 PP there; at least I don’t have one. But what I do have is a W1 Pivot high… so until otherwise proven by D1 I stick to that…. Also don’t forget we are at the end of the month… My entries are not trading at every/any PP on H1… I enter on h1 but based on D1 & I must have a D1. On the 4hr chart I plotted for you the W1 PP
Ignored
Oh sorry, the summer heat today .... now I got confused!
Of course I should look for a price pivot in the daily and then I would switch down into the hourly ...
Is the midpoint of last weeks range important for your system? I do understand S/R lines as lines of important highs and lows ... so what is your experiene with midpoints, if I may ask ?
Ignored
It is the 50% of the range of last week... often when price wants to continue in the previous direction it will not go beyond that... try it out; you will understand what I mean Higher midpoints show strength=> up... And lower ones weakness=> down
This is for learning purposes.
The below chart is current daily GBPJPY
as you can see price is forming a bottom pp.
So according to rules if it closed like this we would be looking for a buy tomorrow.
But looking at the chart, you can see an obvious downtrend since 7th april.
Would that cancel your opinion to buy, or would you still look to buy?
Ignored
To me this is a no trade because the bottom that was formed came in on Sunday. I don’t trade the Sunday Bars, I don’t take any trades on Mondays based on Sunday PP and none on Tuesdays based on Sundays. If the setup is still valid on Wednesday then I might consider it as I tend to add Sundays and Mondays together. If Tuesdays form a setup based on Friday Sunday Monday then I might consider it… If on Mondays a Thursday Friday set up is still valid I trade that instead as I wanted CADJPY earlier today. You following I hope…. Alternatively you can trade the way IB does by taking this GJ as an engulfing bar tomorrow and entering on the retrace.
EDIT: Oh I’m sorry I didn’t answer you completely, down trend or not, if I get a valid signal to buy, I try… So I hope this answers the rest of it…
To me this is a no trade because the bottom that was formed came in on Sunday. I don’t trade the Sunday Bars, I don’t take any trades on Mondays based on Sunday PP and none on Tuesdays based on Sundays. If the setup is still valid on Wednesday then I might consider it as I tend to add Sundays and Mondays together. If Tuesdays form a setup based on Friday Sunday Monday then I might consider it… If on Mondays a Thursday Friday set up is still valid I trade that instead as I wanted CADJPY earlier today. You following I hope….
[font=Calibri][size=3]Alternatively...
Ignored
ok for arguments sake and learning, just ignore sunday candle and treat it as all normal day candles?
ok for arguments sake and learning, just ignore sunday candle and treat it as all normal day candles?
Ignored
Besides everything else I mentioned above, we are currently too close to 130 and last week closed very nicely below it. So I don’t think you’d want to take this one for a buy… I’d try selling it instead once I get the appropriate signal or alternatively you could still go with the last d1 pivot high that was made last Wednesday since it is still valid (chart below)… Hope this answers you
Besides everything else I mentioned above, we are currently too close to 130 and last week closed very nicely below it. So I don’t think you’d want to take this one for a buy… I’d try selling it instead once I get the appropriate signal or alternatively you could still go with the last d1 pivot high that was made last Wednesday since it is still valid (chart below)… Hope this answers you
Ignored
ooo yes, i didnt think to look for still valid setups, i like the short idea of gbpjpy since its nice downtrend i can see on D1
Hey Dean I hope you are doing this on demo! Don’t go jumping the gun on a system you haven't tried, tested and are accustomed with... Please otherwise I’d feel very bad…