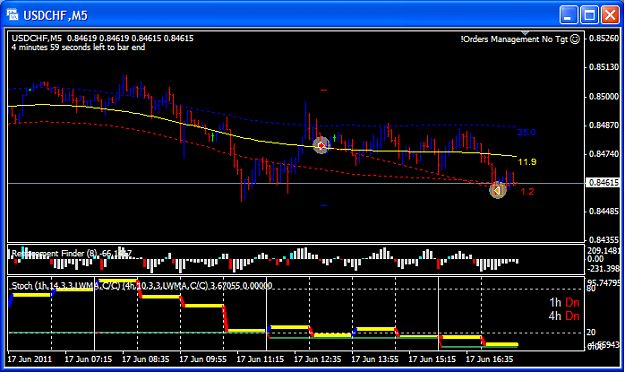
I can see both stochs quite clearly in your chart,
the one that is yellow with flashes of blue & red is the 1hr (the upper line)
the one that is sea green with flashes of blue & red is the 4 hr (the lower line)
you can also hover your mouse over the lines and it will show you what each line is.
In addition the bottom stoch window you have for 4hr is not needed when using the !kevinator indicators.
As someone also mentioned you are missing the TMA indicator on your chart (either TMA.ex4 or TMA with Distance.ex4)