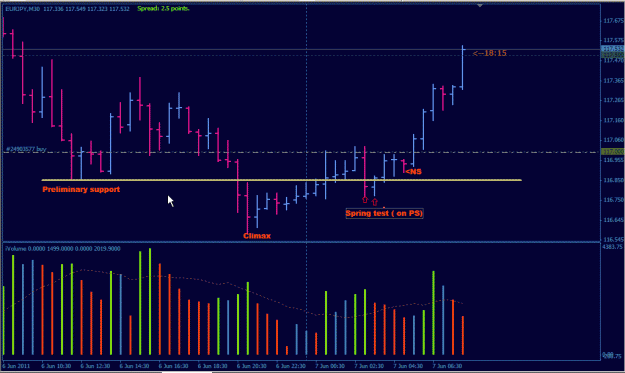
"Potential" and "Confirmed"
Using the 2 definitions I've posted so far (stopping volume and no demand/no supply) let's clarify that these 2 bars alone are not a confirmation, only a potential start.
STOPPING VOLUME:
In this chart, the black line once again represents stopping volume. But we only call it "potential" stopping volume when it appears in real time. We must not have a bar closing below the low of the stopping volume candle for it to become confirmed (in a down trend).
Once the next bar did not CLOSE below our Potential Stopping Volume, then can we label it "Confirmed". In this example the price did go lower then the stopping volume bar, but the close is not lower.
NO SUPPLY:
The no supply (noted with the red line) is a "Potential" no supply until a bar closed above it, 2 bars later. Then it is confirmed and is a typical trade entry. Again we only trade in the direction of our background, and we'll get to that soon.
http://img121.imageshack.us/img121/9361/vsa2.gif
