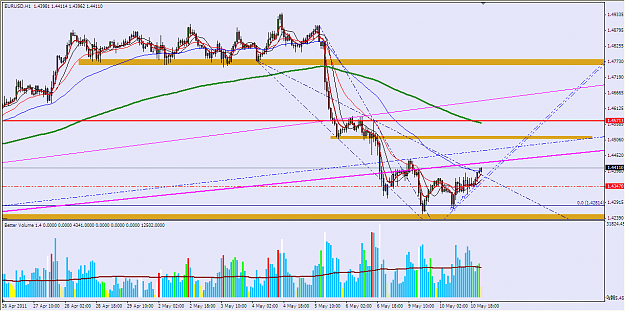
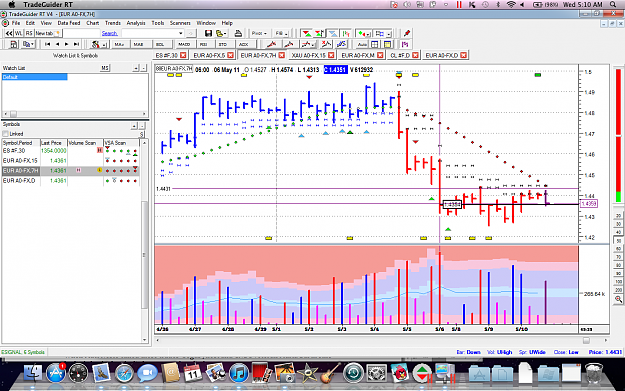
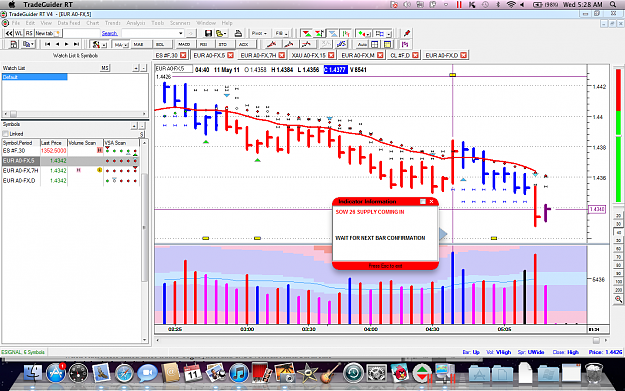
• Home
  • Forums
  • Trades
  • News
  • Calendar
  • Market
  • Brokers
  • Login
  • Join
  • User/Email: Password:
  • 9:42pm
Menu
  • Forums
  • Trades
  • News
  • Calendar
  • Market
  • Brokers
  • Login
  • Join
  • 9:42pm
Sister Sites
  • Metals Mine
  • Energy EXCH
  • Crypto Craft

Options

Bookmark Thread

First Page First Unread Last Page Last Post

Print Thread

Similar Threads

VSA-divergence trading 187 replies

How to Blow $200 account using VSA--- 594 replies

VSA Journal 57 replies

VSA broker history change datas 11 replies

  • Interactive Trading
  • /
  • Reply to Thread
  • Subscribe
  • 12,338
Attachments: vsa with Malcolm
Exit Attachments
Tags: vsa with Malcolm
Cancel

vsa with Malcolm

  • Last Post
  •  
  • 1 973974Page 975976977 1803
  • 1 Page 975 1803
  •  
  • Post #19,481
  • Quote
  • Edited 1:06pm May 10, 2011 12:47pm | Edited 1:06pm
  •  PipPipPip
  • | Joined Jan 2009 | Status: Member | 1,259 Posts
Quoting malcolmb14
Disliked
check 60 ... there is a trigger line from last friday 1.4380.... we are getting much supply in that area still and cannot get above the potential stopping volume.

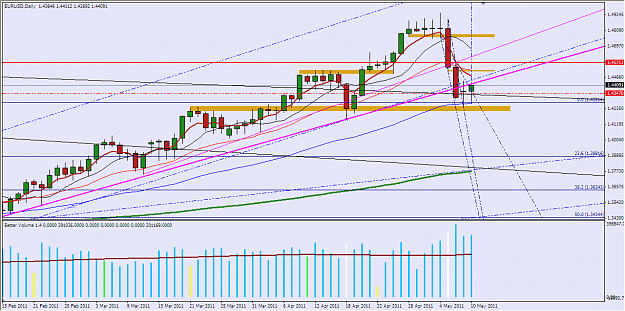
My bet is this is some kind of bear flag , max 1.4450 , then droppage to 1.4100 area by end of week on some bad news.

The es is being sold off that 1350 area . same area we saw supply last friday .... very interesting. I will review 12 hour chart for es today when i get home
Ignored
Ya, es and crude is in momentum. crude is above 100 and I want to see if it holds.

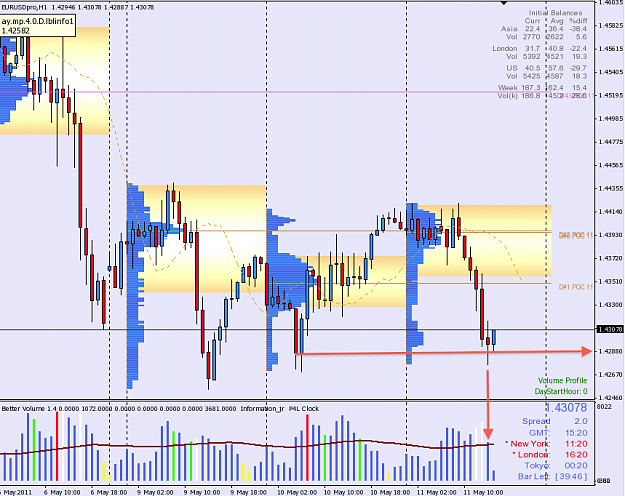
Ya, why not bring it up to 1.4450-1.4520 and bring it back to that 1.4175 shake out in april. I'll be watching that 1.45 and 1.4175 level. A daily close below 1.42, can just bring it down further to 1.40, and a close above 1.45, we might just go back up again.

I was eyeing the 1.4398 trigger from yesterday's. This 1.43 level is key. Thanks for reminding me of friday's trigger.

EDIT:

Treasuries at a large amount are being sold at a 3 year note (xx billion). I hope this is confirmed.
 
 
  • Post #19,482
  • Quote
  • May 10, 2011 1:35pm May 10, 2011 1:35pm
  •  dvarrin
  • | Joined Aug 2007 | Status: Member | 650 Posts
Quoting PipPipPip
Disliked
Good morning.

Looks like some volume accumulation at these bottom levels.
Ignored
Hi PipPipPip,

Could you please explain me what shows us there is accumulation?
 
 
  • Post #19,483
  • Quote
  • May 10, 2011 2:30pm May 10, 2011 2:30pm
  •  PipPipPip
  • | Joined Jan 2009 | Status: Member | 1,259 Posts
Quoting dvarrin
Disliked
Hi PipPipPip,

Could you please explain me what shows us there is accumulation?
Ignored
Hey Dvarrin,

Sorry if I was not clear. I didn’t want to say stopping volume because this is heavy supply/demand area, even with a 600+ pip drop. We were at this level in 2007, after the same high. It was repeated again on April 18th, bought at 1.4310 stopping at 1.4520 (accumulating?), then reached for 1.4850. (550+ pips) (i shouldve’ held that long through 1.48). And the same repeat in 2007.

Sell off repeated hard at 1.48-1.49 for mid term. I took a late sell off at 1.4580 off ND after a new low on the 15, and closed below 1.43. (low risk trade). I couldn’t do it at top, because i did not see any signals (chickened out at top). I could be wrong at exiting early, but it was a safe trade exiting on support/resistance.

There were also two big drops from Sept 2008 and Dec 09-Jan 10 (very little testing) at these drops. And there was 2007 reaching for the new high. This area is crucial. If it holds for several weeks/months similar to 2007, we could go back up, or if it holds several days/weeks like in Sept 08 and from Dec 09-Jan 10, we can possibly see further lows. I want to see some testing of ns and nd and I will probably enter a late position AGAIN to follow the ride down or up. Don’t have that big account to take a risky trade. Just something I am keeping in mind.

Lots of accumulation here.

Maybe someone can point any signs of strength or weakness or something that I am missing. I am trying to keep an interpretive mind here.

I hope this helps, and that I am on the same page with everyone here.

I also posted a chart of the price boxes several posts ago.
 
 
  • Post #19,484
  • Quote
  • May 10, 2011 3:35pm May 10, 2011 3:35pm
  •  dvarrin
  • | Joined Aug 2007 | Status: Member | 650 Posts
Quoting PipPipPip
Disliked
Hey Dvarrin,

Sorry if I was not clear. I didn’t want to say stopping volume because this is heavy supply/demand area, even with a 600+ pip drop. We were at this level in 2007, after the same high. It was repeated again on April 18th, bought at 1.4310 stopping at 1.4520 (accumulating?), then reached for 1.4850. (550+ pips) (i shouldve’ held that long through 1.48). And the same repeat in 2007.

Sell off repeated hard at 1.48-1.49 for mid term. I took a late sell off at 1.4580 off ND after a new low on the 15, and closed below 1.43. (low risk...
Ignored
Woooww! Thank you very much for your answer PipPippip! :-))
 
 
  • Post #19,485
  • Quote
  • May 10, 2011 3:56pm May 10, 2011 3:56pm
  •  PipPipPip
  • | Joined Jan 2009 | Status: Member | 1,259 Posts
Quoting dvarrin
Disliked
Woooww! Thank you very much for your answer PipPippip! :-))
Ignored
np!
 
 
  • Post #19,486
  • Quote
  • May 10, 2011 6:30pm May 10, 2011 6:30pm
  •  Beljevina
  • Joined May 2009 | Status: Trading, Not Posting | 2,130 Posts
I am not spending as much time on the forum/thread lately, having ventured into trading various futures, and am trying to have limited yet precision entries on EU. I unfortunately missed entering at the 427 area, but the uptrend and buying support has been good if surprising. We are being treating to a strong rebound bar/wick in the daily - that is quite often a sign of things to come. Looking at the H1 and M15 timeframes, the buying seems fairly prominent to me.

Once the EU has tried or looked like it's bottomed, the path back up is never clear or straight, so caution should be exercised. I am going to be looking for trendline support, and a possible shakeout in Asia, and looking to go long heavily, at a strategic point; hopefully 1.435 is the last point where that opportunity comes. 1.45 seems like a reasonable target that needs to be tested/hit - lots of reasons to get back up there. EY seems to be in decent upwards mode too - should help EU; gotta watch any news/fundie sideswipes though.

Also posting a 6E chart - while one can deduce there are shorters in the initial drop down to newer/SO levels, the volume on the bars that propels and keeps us above the last low, is massive IMO - compare it to previous stopping volume, on the way up.
Attached Image(s) (click to enlarge)
Click to Enlarge

Name: 2011-05-10_164915.png
Size: 30 KB
Click to Enlarge

Name: 2011-05-10_165010.png
Size: 33 KB
Click to Enlarge

Name: 2011-05-10_183835.jpg
Size: 112 KB
 
 
  • Post #19,487
  • Quote
  • May 10, 2011 6:57pm May 10, 2011 6:57pm
  •  Sambo9
  • | Joined Mar 2011 | Status: Member | 19 Posts
Quoting malcolmb14
Disliked
The up move today may have been due to pomo after the bond auction...

it defo got sold into on a 30 min chart and several bars later we had another ut.

Do not be surprised to see more weakness in the es , but overall it does not quiet seem ready to drop yet .... June may be the month

Attachment 695395
Ignored
Hello Malcolmb,

I looked at your 30 min chart and see indeed selling, however your are speaking about an important move if don't mistake you ( "june may be the month") ? Why do you have this feeling that the market is ready for a correction ?

In the daily chart I can't see any SOW, do you think the supply in the 1330 area we saw at the beginning of march will stop the bull market ? I'm a rookie so if you had few minutes it will be greatly appreciated

Have a good day,
Sambo
 
 
  • Post #19,488
  • Quote
  • May 10, 2011 8:33pm May 10, 2011 8:33pm
  •  malcolmb14
  • Joined Apr 2007 | Status: HARD SHYT SCUBA TRADER | 20,883 Posts
Sambo .. this comment was based on last fridays price action. The NFP was pretty good news but got sold into ... obvious weakness there.

I have noticed when es does this it is in a distribution mode.

Howver for the mean time I am trading day to day

other reason that es may correct POMO ends June .... what is going to hold the stock market up ... some of the moves this week are clearly due to feds in jecting money into the market right after a bond auction

Quoting Sambo9
Disliked
Hello Malcolmb,

I looked at your 30 min chart and see indeed selling, however your are speaking about an important move if don't mistake you ( "june may be the month") ? Why do you have this feeling that the market is ready for a correction ?

In the daily chart I can't see any SOW, do you think the supply in the 1330 area we saw at the beginning of march will stop the bull market ? I'm a rookie so if you had few minutes it will be greatly appreciated

Have a good day,
Sambo
Ignored
Blogging daily now at www.volume.zone
 
 
  • Post #19,489
  • Quote
  • May 11, 2011 8:15am May 11, 2011 8:15am
  •  malcolmb14
  • Joined Apr 2007 | Status: HARD SHYT SCUBA TRADER | 20,883 Posts
watching that 4350 trigger line on a 7 hour chart , under this we may test 4250 / 4150

I am still looking to sell rallies off 1.44 for now

seems they are trying to dry up demand off that 4250 line last 2 days. with es ripping yesterday i would have expected more of a reaction in eu , still major weakness in play
Attached Image (click to enlarge)
Click to Enlarge

Name: Screen shot 2011-05-11 at 5.10.21 AM.png
Size: 290 KB
Blogging daily now at www.volume.zone
 
 
  • Post #19,490
  • Quote
  • May 11, 2011 8:30am May 11, 2011 8:30am
  •  malcolmb14
  • Joined Apr 2007 | Status: HARD SHYT SCUBA TRADER | 20,883 Posts
very nice supply coming in off hat 4380 trigger line for a quick 40 , maybe more , now to prove continued weakness we need no demand on up moves , target 4300 days low , 4260 if that happens
Attached Image (click to enlarge)
Click to Enlarge

Name: Screen shot 2011-05-11 at 5.28.27 AM.png
Size: 291 KB
Blogging daily now at www.volume.zone
 
 
  • Post #19,491
  • Quote
  • May 11, 2011 9:23am May 11, 2011 9:23am
  •  dvarrin
  • | Joined Aug 2007 | Status: Member | 650 Posts
Hi,

Anybody could explain how we have to do when we see ND and one or two bars later there is NS or the reverse. It often happen to me and I often stay with the first signal, but it often turns out that I'm wrong. In which case should we reverse? What can we use as a stoploss?
 
 
  • Post #19,492
  • Quote
  • Edited 10:46am May 11, 2011 10:45am | Edited 10:46am
  •  msmarple
  • Joined Oct 2008 | Status: Just be the witness. | 1,089 Posts
Quoting dvarrin
Disliked
Hi,

Anybody could explain how we have to do when we see ND and one or two bars later there is NS or the reverse. It often happen to me and I often stay with the first signal, but it often turns out that I'm wrong. In which case should we reverse? What can we use as a stoploss?
Ignored
Hi dvarrin,

good question. I am just learning VSA, but for this " problem " you mention I really only see 2 solutions :

a) focus less on single bars and concentrate more on background strength/weakness - especially by looking at higher timeframes. At first I found it a bit strange that the VSA experts here talk about weekly or daily levels ( like PipPipPip or Malcom ), now I see their importance.

b) use trigger levels like Pres78 shows, as then the context of whole waves and moves around certain price levels ( and their testing ) becomes clear.

I think both of these points grow with experience and screentime.....

But I am only learning bit by bit......


_____________
michael
Be like water.
 
 
  • Post #19,493
  • Quote
  • May 11, 2011 10:55am May 11, 2011 10:55am
  •  dvarrin
  • | Joined Aug 2007 | Status: Member | 650 Posts
Quoting msmarple
Disliked
Hi dvarrin,

good question. I am just learning VSA, but for this " problem " you mention I really only see 2 solutions :

a) focus less on single bars and concentrate more on background strength/weakness - especially by looking at higher timeframes. At first I found it a bit strange that the VSA experts here talk about weekly or daily levels ( like PipPipPip or Malcom ), now I see their importance.

b) use trigger levels like Pres78 shows, as then the context of whole waves and moves around certain price levels (...
Ignored
I can see such cases at a trigger level and as those levels are at key points the price could very well go in one direction or the other. That's really difficult to say. Is there a way to say: "Here I have to reverse", without it being to late.
 
 
  • Post #19,494
  • Quote
  • May 11, 2011 11:12am May 11, 2011 11:12am
  •  Robbin Banks
  • | Additional Username | Joined May 2011 | 48 Posts
morning all...i was hoping someone could answer a question for me...still reading MTM, btw, its alot to absorb...but regarding the EU(1h)...we had this move down, the last 2 white candles were wide spread and low volume, then we get one more higher volume candle that shot down but closed in the middle..so queston is is this SM dumping there shorts and buying back in at a better price to go long or is this SM wanting you to think thats the case so you will buy in and then they keep diving down???...or am i completely wrong about all of it???..thanks for any review...regards, RB
Attached Image (click to enlarge)
Click to Enlarge

Name: eu1hvsa.jpg
Size: 90 KB
 
 
  • Post #19,495
  • Quote
  • May 11, 2011 11:23am May 11, 2011 11:23am
  •  tgwhbb
  • | Joined May 2010 | Status: Day by Day | 1,004 Posts
VSA experts, would you consider this last hour on EU as a low vol test of yesterday's H1 trigger @4285?

Thanks!
Attached Image (click to enlarge)
Click to Enlarge

Name: EU H1 2011-05-11 at 11.20.08 AM.png
Size: 83 KB
Change is the only constant
 
 
  • Post #19,496
  • Quote
  • May 11, 2011 11:29am May 11, 2011 11:29am
  •  dvarrin
  • | Joined Aug 2007 | Status: Member | 650 Posts
Quoting Robbin Banks
Disliked
morning all...i was hoping someone could answer a question for me...still reading MTM, btw, its alot to absorb...but regarding the EU(1h)...we had this move down, the last 2 white candles were wide spread and low volume, then we get one more higher volume candle that shot down but closed in the middle..so queston is is this SM dumping there shorts and buying back in at a better price to go long or is this SM wanting you to think thats the case so you will buy in and then they keep diving down???...or am i completely wrong about all of it???..thanks...
Ignored
I think it is buying from the SM. For me there is nothing looking like a trap.
It looks like the variation of stopping volume with that wide spread down bar on very high volume and the next bar closing off the low.

If there is a test at this level on low volume it could well be a long entry.
 
 
  • Post #19,497
  • Quote
  • May 11, 2011 11:33am May 11, 2011 11:33am
  •  Robbin Banks
  • | Additional Username | Joined May 2011 | 48 Posts
thanks dvarrin...just trying to start to impliment some of what im reading...but i guess theres no definative way to know in foresight is that right?...regards, RB
white bar is low volumw wide rande..right?....
 
 
  • Post #19,498
  • Quote
  • May 11, 2011 11:42am May 11, 2011 11:42am
  •  pres78
  • Joined Sep 2010 | Status: I'm not here... or am I? | 3,990 Posts
Quoting dvarrin
Disliked
I can see such cases at a trigger level and as those levels are at key points the price could very well go in one direction or the other. That's really difficult to say. Is there a way to say: "Here I have to reverse", without it being to late.
Ignored
Background is important with triggers as well as most of the best trigger occur at or near a turning point / change in trend. Let's us a downmove leading into a long for example...

1. We will usually start to see some higher volume downbars closing off their lows showing us some potential hidden buyers. Remember strength shows up in downbars. Many times this will culmulate with a squat bar or a SO or stopping volume.
2. We will mark on on highest volume triggers in the current PA zone also taking note of any above or below us which could serve as S/R and triggers.
3. We have seen some possible SOS and have worked our way back above a high volume trigger so now we would be looking for a long set-up with a test or ND into the trigger.

If we get below the trigger than we would be watching for a short set-up.

Now the other side is if we see a major SO bar and then next bar is up many times price will take off and never return to test. The options with SO's are to buy the bar after the confirmed buyers or wait for a NS to appear in a rising market (or vise versa for a high volume UT leading into a short)...
Today's zone = Tomorrow's opportunity!
 
 
  • Post #19,499
  • Quote
  • May 11, 2011 11:43am May 11, 2011 11:43am
  •  pres78
  • Joined Sep 2010 | Status: I'm not here... or am I? | 3,990 Posts
Quoting dvarrin
Disliked
I can see such cases at a trigger level and as those levels are at key points the price could very well go in one direction or the other. That's really difficult to say. Is there a way to say: "Here I have to reverse", without it being to late.
Ignored
Can you post and example chart of what you are seeing / looking at?
Today's zone = Tomorrow's opportunity!
 
 
  • Post #19,500
  • Quote
  • May 11, 2011 11:59am May 11, 2011 11:59am
  •  malcolmb14
  • Joined Apr 2007 | Status: HARD SHYT SCUBA TRADER | 20,883 Posts
classic set up in eu ....make it look like they are buying , moving it up off that key 4250 area ... this is drying up demand so when they bust a move thru 4250 to 1.4 there is no one selling aginast them ...

What gave it away was es ripped yesterday and eu did NOTHING ... 40 pip up move. You will see this over and over in charts.

Quoting Robbin Banks
Disliked
morning all...i was hoping someone could answer a question for me...still reading MTM, btw, its alot to absorb...but regarding the EU(1h)...we had this move down, the last 2 white candles were wide spread and low volume, then we get one more higher volume candle that shot down but closed in the middle..so queston is is this SM dumping there shorts and buying back in at a better price to go long or is this SM wanting you to think thats the case so you will buy in and then they keep diving down???...or am i completely wrong about all of it???..thanks...
Ignored
Blogging daily now at www.volume.zone
 
 
  • Interactive Trading
  • /
  • vsa with Malcolm
  • Reply to Thread
    • 1 973974Page 975976977 1803
    • 1 Page 975 1803
1 trader viewing now
  • More
Top of Page
  • Facebook
  • Twitter
About FF
  • Mission
  • Products
  • User Guide
  • Media Kit
  • Blog
  • Contact
FF Products
  • Forums
  • Trades
  • Calendar
  • News
  • Market
  • Brokers
  • Trade Explorer
FF Website
  • Homepage
  • Search
  • Members
  • Report a Bug
Follow FF
  • Facebook
  • Twitter

FF Sister Sites:

  • Metals Mine
  • Energy EXCH
  • Crypto Craft

Forex Factory® is a brand of Fair Economy, Inc.

Terms of Service / ©2023