Hi Nomask,
Thanks for publishing your method of trading which I think is a very sensible approach.
I have a couple of questions (apologies if I have missed your earlier answers to these)
Roughly, how many entries do you make per week on EUR/USD?
I notice that you only post observations on EUR/USD but do you trade any other markets with this method?
Thanks,
Paul
Ignored
I get 1-2 signal per week on 4hr basis..
But in terms of entry its about 4 entries a week.mostly they die at b.e
I check other pairs weekly but only trade eu these days because I don't have enough time to observe other pairs..
My favorite pair is eu and its been giving me enough opportunities.
Honestly most of the time I don't even bother myself whats happening on other pairs.
Because I'm already watching and trading the most popular pair in the world..
Ignored
Thanks for your reply. I only ask about the number of entries because I know you trade with low leverage and I guess you are in it for the long term building your account slowly. You wont be overtaking Warren Buffet's account any time soon
Thanks for your reply. I only ask about the number of entries because I know you trade with low leverage and I guess you are in it for the long term building your account slowly. You wont be overtaking Warren Buffet's account any time soon
Ignored
haha.
I don't think that either.But I'm trying something way harder than he succeeded.
by the way eu made my decision right about not trading it..Its just been ranging but going nowhere since my last post..
|
Joined Feb 2011
|
Status: Trade the hot hand.
|668 Posts
Am I on the right track that this could be an opportune time to take a counter trend trade? We are after all near weekly supply and weekly trendline. Four hour candle closes in 50 minutes for me and looks to be a convincing down move.
Edit: I'm aware it is currently against our hindsight but it you've got to think their is some downward pressure and who knows this could always be the start of a larger trend. So would it be wise to take a low risk entry and hopefully get my stop to BE and then let the market prove me wrong?
I think I will at least work on my entries on SIM with this opportunity.
Edit: Bar ended up forming more like a pinbar than I like to see even though the body was red. I suppose we could still go further but I'm not convinced of direction yet.
Twitter: @zusch_ -- Preselecting trending pairs, stocks on a weekly basis.
Am I on the right track that this could be an opportune time to take a counter trend trade? We are after all near weekly supply and weekly trendline. Four hour candle closes in 50 minutes for me and looks to be a convincing down move.
Edit: I'm aware it is currently against our hindsight but it you've got to think their is some downward pressure and who knows this could always be the start of a larger trend. So would it be wise to take a low risk entry and hopefully get my stop to BE and then let the market prove me wrong?
I think I will...
Ignored
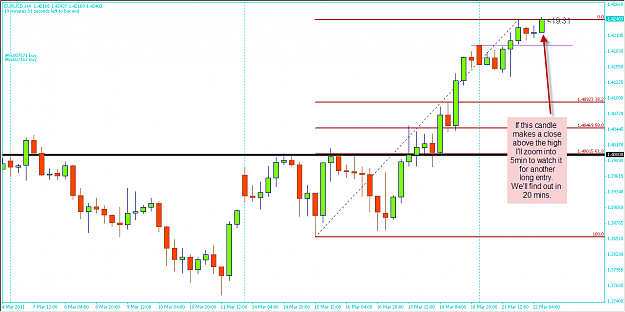
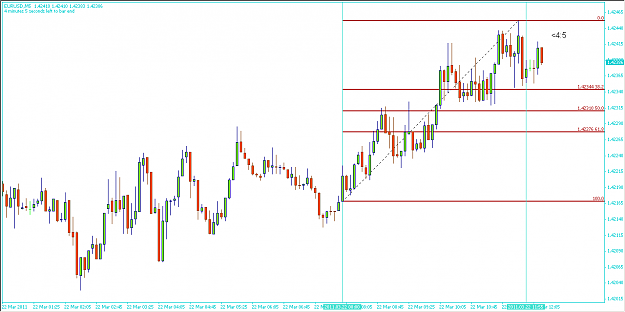
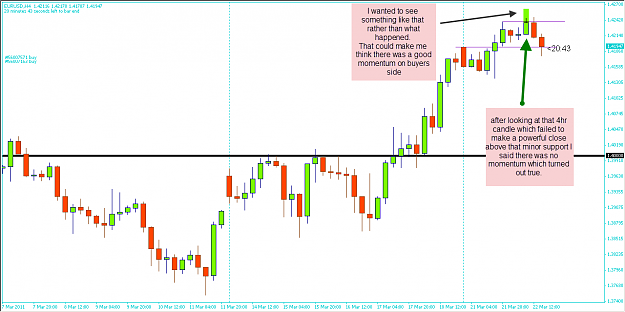
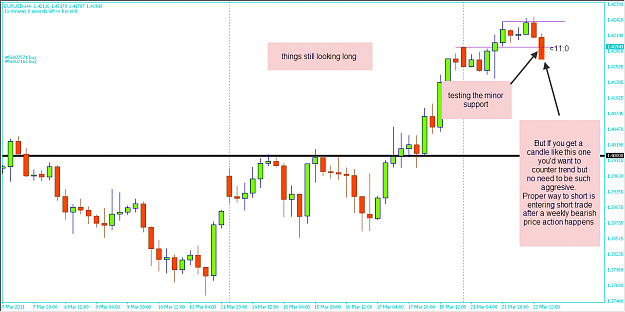
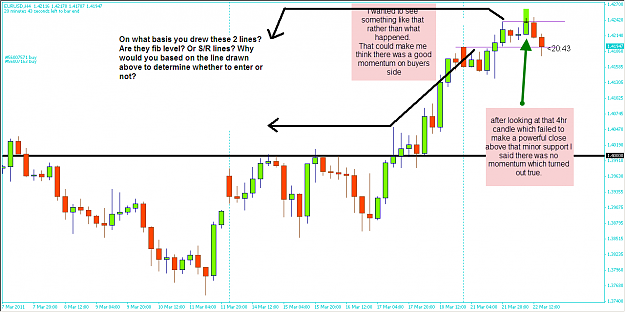
Counter trading is fine only if you can do it in a very disciplined way.If you tent to over trade I don't recommend counter trading.
most of the time its just unnecessary.But I do counter trade sometimes since its the only exciting thing I can do with this method
When the price hesitates breaking a level ,usually there is no good momentum following it.
chart's attached.
Ignored
I can see that you based on the upper lines drawn to determine if you should enter long position or not. If the price break it with strong momentum, then you will enter.
However, I don't quite understand on what basis you draw the two lines on the 4hr chart. Are they fib level or S/R lines?
Apart from that, I hereby attached my chart and I have also included my interpretation on the price action. I will be deeply appreciated if you could take a look and give comment so that I know if I'm on the right track.
Good questions. Just by looking at the two lines, the upper is resistance which Nomask must have been waiting to see a break above it then look for PA and make another long entry. The bottom line however puzzles me a little but if i look at this line as an area/zone and not just a line, i suspect Nomask must have been waiting for a bounce off the second lower line to maybe make another long entry....so you are right they are S / R Lines. Lets also wait for Nomask to respond.
I can see that you based on the upper lines drawn to determine if you should enter long position or not. If the price break it with strong momentum, then you will enter.
However, I don't quite understand on what basis you draw the two lines on the 4hr chart. Are they fib level or S/R lines?
Apart from that, I hereby attached my chart and I have also included my interpretation on the price action. I will be deeply appreciated if you could take a look and give comment so that I know if I'm on the right track.
|
Joined Aug 2010
|
Status: Trader
|167 Posts|
Online Now
Hi nomask (and all guys here as well ),
first of all I want to thank you for publishing this thread and sharing your approach, this is the thread I would rate very very high :-)
I would like to bring smth interesting to your method, I think it can really multiple your profits, if applied correctly. Please check these links (threads) if you have some time, I think at least it's worth to test it w/ your method of catching trend.
Shortly: it's manual trading tool called snowball and it's adding positions as trend continues ... I'm testing it for some time and it's really gem. Now I see strong potential, since I have found your thread nomask.
I can see that you based on the upper lines drawn to determine if you should enter long position or not. If the price break it with strong momentum, then you will enter.
However, I don't quite understand on what basis you draw the two lines on the 4hr chart. Are they fib level or S/R lines?
Apart from that, I hereby attached my chart and I have also included my interpretation on the price action. I will be deeply appreciated if you could take a look and give comment so that I know if I'm on the right track.
Thanks.
Ignored
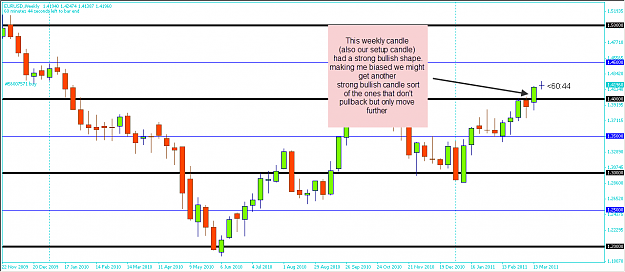
few posts ago I mentioned about the possibility of this week being a straight bold up candle due to the last week's shape and strong close above 1.4 level..
Sometimes we get strong weekly candles with momentum behind it.
For this type of weeks, first one or two days of the week are the only times we can enter at a nice location.
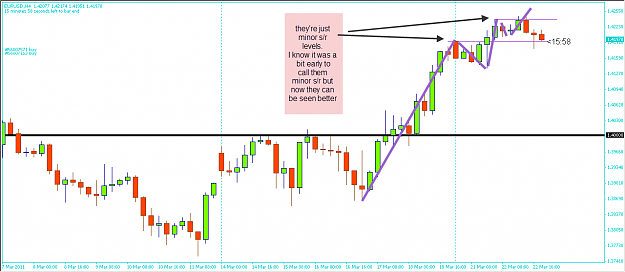
I just tried to play very simple breakout candles at minor s/r levels.
another thing for the lower line is that although I defined it as a minor s/r level Its also opening level of the weekly candle which price respects that so many times.
I can see that you based on the upper lines drawn to determine if you should enter long position or not. If the price break it with strong momentum, then you will enter.
However, I don't quite understand on what basis you draw the two lines on the 4hr chart. Are they fib level or S/R lines?
Apart from that, I hereby attached my chart and I have also included my interpretation on the price action. I will be deeply appreciated if you could take a look and give comment so that I know if I'm on the right track.
Thanks.
Ignored
hello lian.
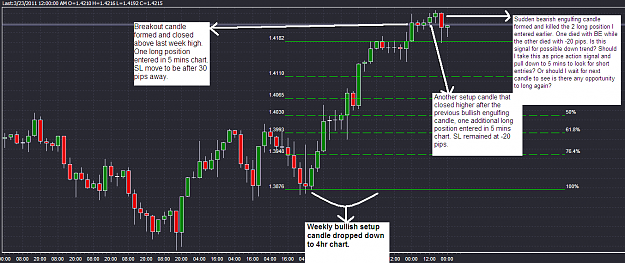
on your chart,first breakout candle seemed okay but if it did not move for the next 4hr you should've started thinking to close it early and second one was not a engulfing candle its got very small body and still stayed within the consolidation.
and 20 pips fixed stop sounds big to me.I rarely let market to hit 10 pips of stop
hello lian.
on your chart,first breakout candle seemed okay but if it did not move for the next 4hr you should've started thinking to close it early and second one was not a engulfing candle its got very small body and still stayed within the consolidation.
and 20 pips fixed stop sounds big to me.I rarely let market to hit 10 pips of stop
Ignored
Thanks for your reply and comment.
Now I understand how you come out with the 2 lines drawn.
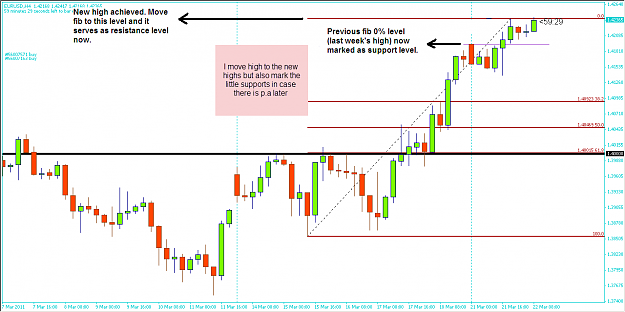
Based on your reply to Zusch in few posts earlier, you mentioned that you will move the fib level to new high. Therefore, the lower line is the high of the last week candle and it is now serve as support level. Whereas the upper line is the new high achieved in this week and serve as resistence level. Is it correct?
So my questions are as follows:
1) Why move the fib to new highs? Isn't that we enter long when we see the price broke and closed above last week's high?
2) I thought the fib drawn on 4hr tf narrowed down from last week's bullish candle signal will be fixed as it is? In what circumstances we need to move the fib to new highs?
3) If the price now soar higher than the new highs that we have set, do we need to move the fibs to new highs again?
Sorry for the lenghty post and question asked, as I'm keen to learn your approach and hope that I can avoid unnecessary sloppy entries next time.
Now I understand how you come out with the 2 lines drawn.
Based on your reply to Zusch in few posts earlier, you mentioned that you will move the fib level to new high. Therefore, the lower line is the high of the last week candle and it is now serve as support level. Whereas the upper line is the new high achieved in this week and serve as resistence level. Is it correct?
So my questions are as follows:
1) Why move the fib to new highs? Isn't that we enter long when we see the price broke and closed above...
Ignored
correct.
1.& 2. it is just something you can't ignore if market is moving and making new highs/lows out of your weekly candle that you placed your fibs and started watching on 4hr t.f.
people love to cover most recent highs/lows thats pretty much of why I move fib to the new hi/lo points.
3.Yes we do need to move it to the new highs and mark the previous minor s/r levels in case there is p.a or reentry opportunities
btw..all two positions died at b.e from this week..old position is still on
I was a silent lurker in the Millipede thread for the past couple of months and found your additions to the thread to be invaluable. I appreciate all that you've done here as well and my results from following this thread have been instrumental in my gaining the courage to signing up for my first live account. I was hoping that you could shine light on one thing I've been thinking about lately with this method, however.
I remember Graeme said that only less than 5% of his hundreds of entries made it to the "final door of profits". With a .02% risk and a very small stop loss, couldn't we afford to take "other" entries besides engulfing candles on the fibs of the 4 hour and double tops/bottoms? (eg. 1-2-3 setups, pennants, flying buddhas) Are we placing/stacking enough entries to see the kind of returns that are capable with a method such as this?
I'm pretty new to all of this so I'm just trying to wrap my head around it. I can see how this method requires extreme discipline and because of this I am sure that your ideas will produce some profitable traders. I am looking forward to more of your wisdom in this thread. Thank you again for everything.