Okay, let's do things a bit different this time. I was originally going to do a bar-by-bar of this chart, but I am feeling a bit lazy now. Instead I would like for all to either critique, ask questions, or both about the chart.
I will however, mention a few things about some of the bars.
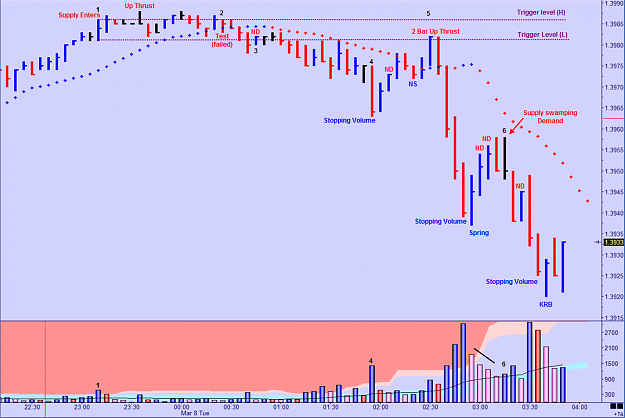
#1: It's hard to see now, but this was the high volume bar that started it all. A wide spread up bar on ultra high volume closing in the middle. Whilst it is true that there are three parts to it, we know that markets do not like high volume up bars. We also know that a close in the middle of the range is significant.
If this bar is strength we would like to see a test within 5 bars. By that same token, we would like to see signs of weakness within 5 bars as well. 2 bars later there is a No Supply bar but the market only moves sideways. 5 bars later there is an Up Thrust.
The market moves sideways.
#2: Advanced sign of weakness. We get a nice down bar on volume less than the previous two bars that closes near its high. This is a Test. Note that the top of the Test bar is equal to the high of #1. Also note the price action leading up to this bar with respect to the trigger level. Now note the next bar. It closes down. This means the Test has failed. That's a sign of weakness. Aggressive entry.
#3: Three is a better entry as we can see that the trend has changed and its our old friend No Demand.
As I said, I am not going to do all the bars I had intended to do, so I will skip to #6.
#6: After seeing Stopping volume, followed by a series of up bars on low volume (No Demand), we get an equal close on a bar that fails to make a higher high but makes a lower low and closes near its low. This bar is supply swamping demand. If you were watching in real-time, you would have seen this bar make the low, push up for the rest of the interval and the collapse just before the end of the period.
Couple this Bar with the No Demands and the fact that the trend is down and you have another signal to get short. As some may have been looking for a confirmed long entry, this timeframe was saying there is some more to go on the down side.
Okay, I'm done. Let the critique begin.
I will however, mention a few things about some of the bars.
#1: It's hard to see now, but this was the high volume bar that started it all. A wide spread up bar on ultra high volume closing in the middle. Whilst it is true that there are three parts to it, we know that markets do not like high volume up bars. We also know that a close in the middle of the range is significant.
If this bar is strength we would like to see a test within 5 bars. By that same token, we would like to see signs of weakness within 5 bars as well. 2 bars later there is a No Supply bar but the market only moves sideways. 5 bars later there is an Up Thrust.
The market moves sideways.
#2: Advanced sign of weakness. We get a nice down bar on volume less than the previous two bars that closes near its high. This is a Test. Note that the top of the Test bar is equal to the high of #1. Also note the price action leading up to this bar with respect to the trigger level. Now note the next bar. It closes down. This means the Test has failed. That's a sign of weakness. Aggressive entry.
#3: Three is a better entry as we can see that the trend has changed and its our old friend No Demand.
As I said, I am not going to do all the bars I had intended to do, so I will skip to #6.
#6: After seeing Stopping volume, followed by a series of up bars on low volume (No Demand), we get an equal close on a bar that fails to make a higher high but makes a lower low and closes near its low. This bar is supply swamping demand. If you were watching in real-time, you would have seen this bar make the low, push up for the rest of the interval and the collapse just before the end of the period.
Couple this Bar with the No Demands and the fact that the trend is down and you have another signal to get short. As some may have been looking for a confirmed long entry, this timeframe was saying there is some more to go on the down side.
Okay, I'm done. Let the critique begin.
Attached Image (click to enlarge)
Without VSA, you're playing checkers while the Smart Money plays chess.