Most of you have heard of indicators and are very familiar with their signals (divergence for instance) but one thing that most people miss are the "hidden" divergences. These divergences are not only with the trend but identify moments when rallies in a downtrend and dips in an uptrend MAY come to a halt. I have built this system around this principle of buying low in a uptrend and selling high, we don't want to trade a breakout MOST of the time because breakouts are usually fakeouts. We want to take advantage of a clear trend by getting on the train so to speak. With that said here are a few indicators and terms that the newbie must be familiar with before learning this system:
1) ATR (average true range)
2) Candlesticks (Japanese)
3) Bollinger Bands
4) Stochastic
5) EMA
6) DNC channel (donchian channel)
7) Risk/Reward equality (the difference between your stop on ALL contracts and your first limit or target)
8) Hidden Div (when price makes HL indicator makes LL, reverse for sell examples) go to babypips.com school to learn more about this
9) Fractals
Now that that is out of the way and you know all you need to know about these indicators and terms its time to dive in . First off the indicator settings are as follows:
1) ATR (set to 5 periods)
2) Candlesticks (whatever color desired)
3) Bollinger bands (20,2 SMA bollinger bands)
4) Stochastic (10,4,4 EMA smoothed)
5) EMA (set to 50)
6) DNC channel (set to 20 and set it to monitor closing prices only, it really doesn't matter as long as it identifies the highest close in the trend, you don't really need them if you have a good eye)
7) Fractal indicator (5 bars for a fractal)
Ok that is it for the indicators. If you can't get any of these indicator values please don't bother me with the questions ask your platform manager because I'm not too good with other platforms other than MT4 and FXCM marketscope
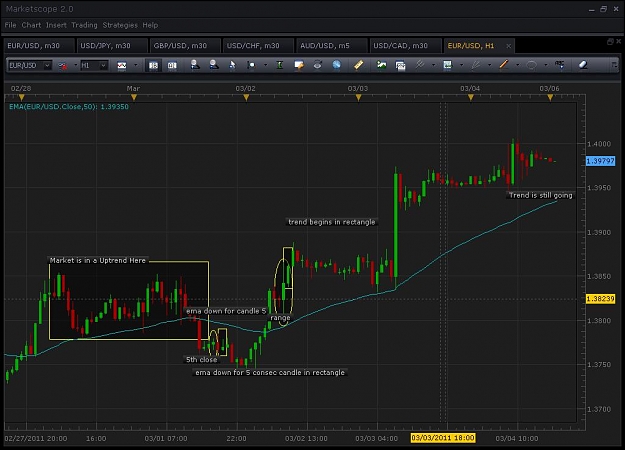
To start let me define the words "range" and "trend", in this system a range is when price has been in a trend (in this example down) (we'll get to that later) and then price crosses the 50 ema (closing above it for a min. of 5 candles AND the 50ema is up for either the 5th bar or more (price can close above it 5 times but still not turn the 50 ema)). A turn is defined as more than .2 pips. The market is now in a range and there is no trading this system.
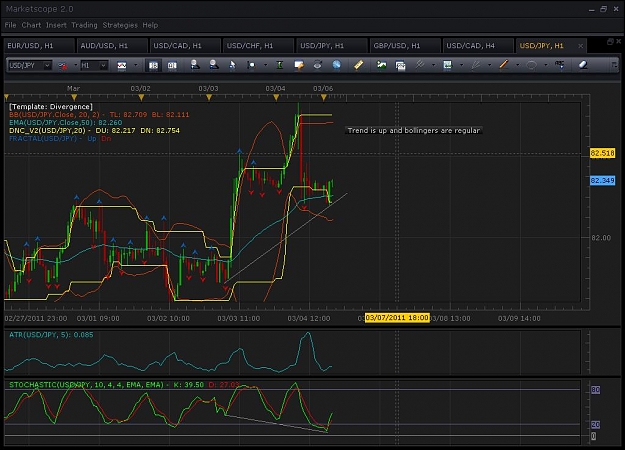
The market is in a "trend" when the 50 ema is up more than .2 pips for 5 consecutive candles after it has been in a range (see above). See picture below
Now that you know what a trend and range is in this system let's go over the buy trade signal:
Buy Signal
1. The trend must be up (see above)
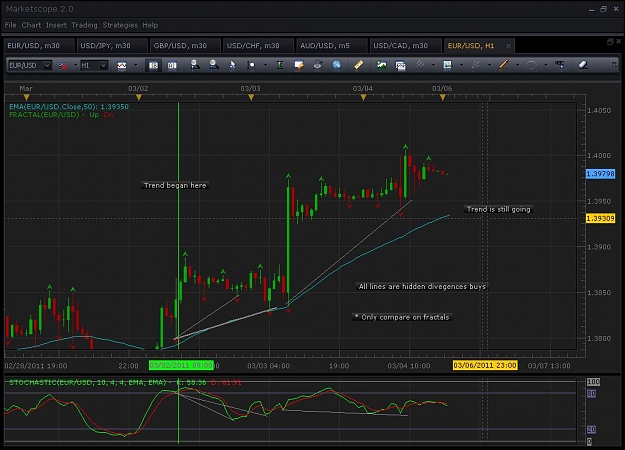
2. Stochastic must be in position to make a hidden div (see picture below) Note:Only compare stochastic levels at fractals, i.e. run your crosshair from fractal down to indicator and see stochastic level, then wait for current price to be higher.
3. Once it is in a position to make the hid. div. wait for a Jap candle formation (doji star, engulfing, piercing line etc...) then let %k (fast line) turn 1 point (stochastic points are plotted 0 to 100) on a candle that closes in its upper half (indicating strength), if the candle stoch %k turns on closes below 50% of its range wait for next candle and %k to move up 1 point again. You now have a signal to trade.
4. When drawing hidden div lines you CAN draw through a peak or valley like I did in the example but when you have to draw a line through (not connecting) there must be a regular div accompanying it.
Note: Reverse for sells (trend must be down and stochastic %k must turn down not up)
Now you must determine how much you are going to risk on this trade. My "base" risk is .75% (seem small? Well change it to your liking I don't care) I then add or take away market "factors" as follows:
Other indicators with trade: risk .1% more/less if they are with/against
Steep trend: more than 60 degrees in a trend is a steep trend that is likely to reverse risk .1% less on this trade.
1hour b4 minor news: risk .1% less
Up against daily/weely pivot point: risk .1% less if pivot is blocking trend risk .1% more if it is supporting trend.
You can come up with your own market "factors" and how much to risk for your "base". Note that this is max risk (.75% puts my max risk at 1.15% and my min at .25%).
Here is a step-by-step process to figure out your Limit (to take 1/2 of position off) on the trade (all examples are buy trades):
1) Are the bollingers "pinching" in? If they are use ATR 5 to set your target (1 times ATR 5 value ON SIGNAL CANDLE) this value will have to be added to your entry once it is determined (see "the entry price" below). If they are normal trending bollinger bands (wide and not pinching) revert to steps 2-3
2) Determine whether the signal candle (candle that turned stoch. to make hid. div.) closed within 5 pips or so of the highest DNC upper channel in the trend (use DNC channel to identify this) if it did use ATR 5 to set target (just as above). If not, Revert to step 3.
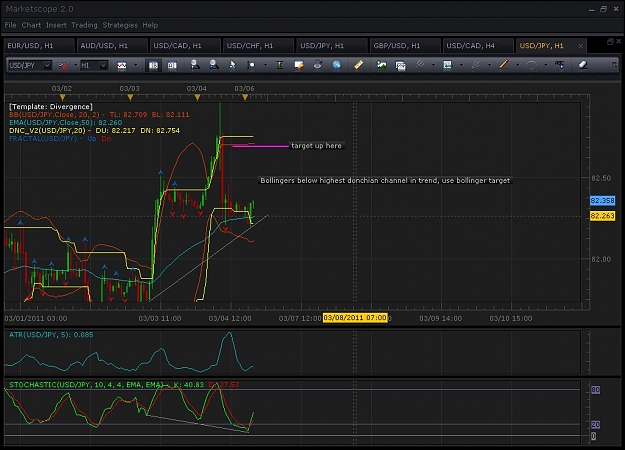
3) Determine whether the bollinger band is above the highest DNC upper channel level. If it is use DNC upper channel as limit (subtract a pip or two in case price drastically reverses near it which sometimes happens). If the bollinger band is not above the highest DNC upper channel in the trend use bollinger band as first target (minus a few pips)
4) If you could only grab 1 lot (whatever size) on the trade then use a pivot or fib level to exit the 1 lot.
Here is a step-by-step guide to placing stops:
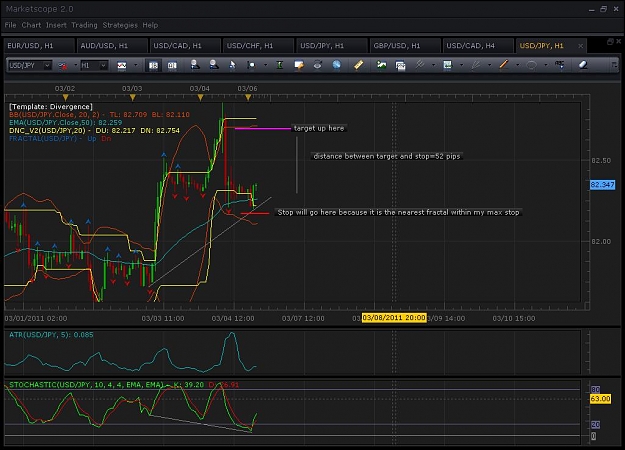
1) Determine your limit (above) and then multiply your limit in pips by two to get your max stop distance if using ATR (for instance use ATR 5 limit because bollingers are pinching putting target 15 pips away) In this example max stop is 30 pips. If not using ATR limit find the nearest fractal and put your stop under there then just find the entry
2) Now that you know your max stop distance find a fractal around that area (not beyond max though) and put it 3 pips below it for all pairs with USD as the last currency in pair (EUR/USD, AUD/USD are examples). 2.5 pips for USD based pairs (USD/JPY, USD/CAD).
3) If there is no fractal (there is 99% of the time) use big bars in the direction of trend for original stop (never exceed max).
4) Now that you know your stop you need to find out how many lots to grab. If your trading mini lots (10,000 of base currency) and your stop is 30 pips which is .5% of your account (you determine that max risk on trade is 1% which is 60 dollars of a 600 dollar account) you then grab 2 lots to equal 60 dollars of risk.
The Entry Price
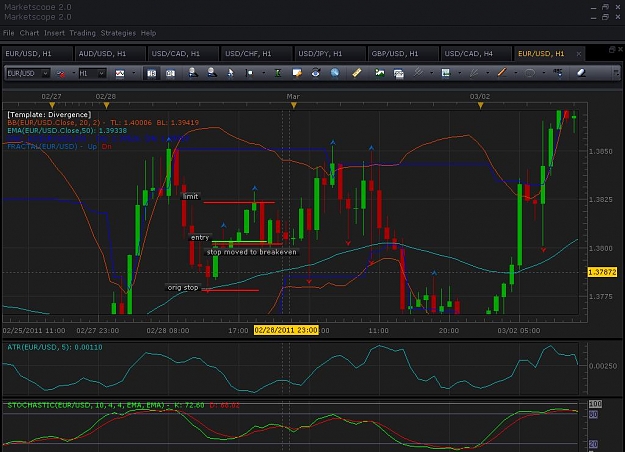
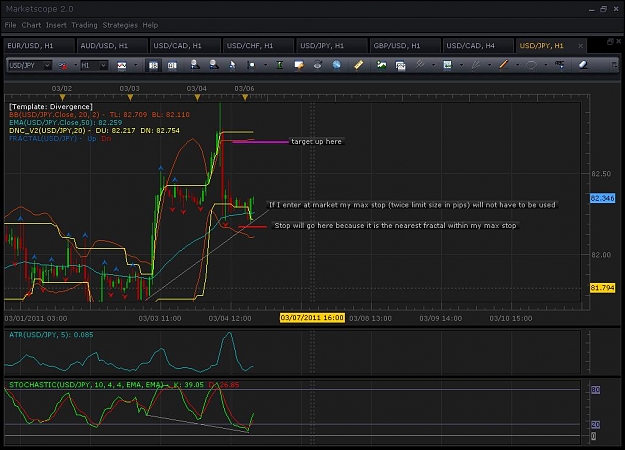
1) To figure out the entry price you need to know your stop position and your limit size in pips then take a horizontal line and put it at the current market price after the signal candle. See if the stop size is not more than two times the first limit size (remember the first limit takes off 1/2 of the position). Its that simple start with an entry at market, if it lines up with the rules (stop not more than 2 times limit) take it if not move the order until it lines up (as long as the order doesn't want price to come to the high of a sell signal bar or the low of a buy signal bar)
When to Cancel an Entry Order
Cancel the Entry order after either 3 candles pass or price hits your would-be first target if the target is an ATR target I want price to move 1.5 times it before I cancel the order (because I don't want price to retrace that much)
Trailing your Stop:
Now that you know how to find the original stop you must know how to trail it:
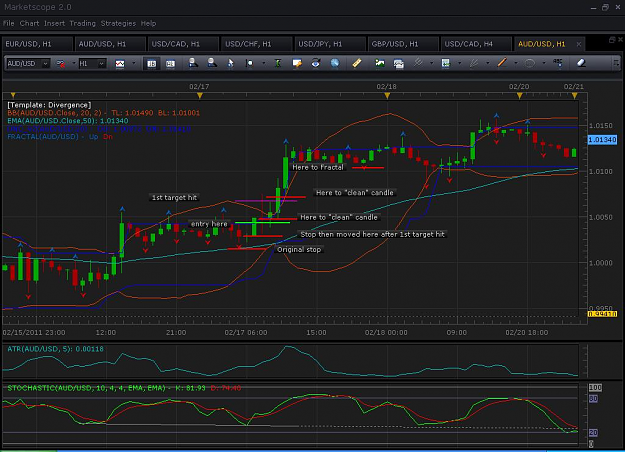
1) Once price makes a "clean bar" (bar which opens in lower-third and closes in upper-third and makes a new high since entry) put stop 3 pips below it for pairs with /USD as last symbol or 2.5 pips for pairs with USD/ as first symbol. Also trail stop at every "fractal" also (I have a robot which does this for me if I'm sleeping during which I can't use the clean bar rule, but this is just part of trading)
2) Once first target is hit the stop MUST (doesn't rely on clean bar, or fractal) move to at least half of original risk and at max to breakeven.
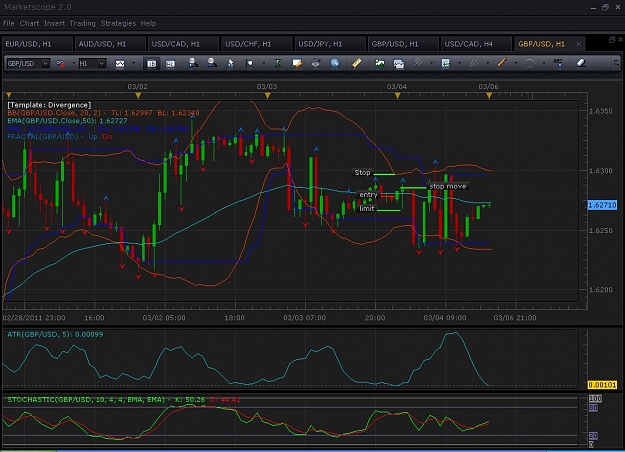
3) In the end stop trailing is summed up by this example, in this example green line is entry, lowest red line is original stop while other reds are stop trail, pink is first target (based on ATR since price closed above highest DNC upper channel in trend): See AUD trade below
I will be posting many more examples and youtube videos as I come up with them but here are a few picture examples for now:
See both of these trades below, granted this week's trades got very whipsawed because of indecision wrapped around NFP
Don't worry if this all seems complicated the procedure is actually so easy and I will explain it in detail with a few youtube videos. But be aware that this system is so powerful and it will make great consistent profits (80% of the time it hits the first target). Again I'm not too great with words so just ask me about something and I will try my best to answer it. Thanks for reading about this system I hope you can use this to find hidden wealth.
1) ATR (average true range)
2) Candlesticks (Japanese)
3) Bollinger Bands
4) Stochastic
5) EMA
6) DNC channel (donchian channel)
7) Risk/Reward equality (the difference between your stop on ALL contracts and your first limit or target)
8) Hidden Div (when price makes HL indicator makes LL, reverse for sell examples) go to babypips.com school to learn more about this
9) Fractals
Now that that is out of the way and you know all you need to know about these indicators and terms its time to dive in
1) ATR (set to 5 periods)
2) Candlesticks (whatever color desired)
3) Bollinger bands (20,2 SMA bollinger bands)
4) Stochastic (10,4,4 EMA smoothed)
5) EMA (set to 50)
6) DNC channel (set to 20 and set it to monitor closing prices only, it really doesn't matter as long as it identifies the highest close in the trend, you don't really need them if you have a good eye)
7) Fractal indicator (5 bars for a fractal)
Ok that is it for the indicators. If you can't get any of these indicator values please don't bother me with the questions ask your platform manager because I'm not too good with other platforms other than MT4 and FXCM marketscope
To start let me define the words "range" and "trend", in this system a range is when price has been in a trend (in this example down) (we'll get to that later) and then price crosses the 50 ema (closing above it for a min. of 5 candles AND the 50ema is up for either the 5th bar or more (price can close above it 5 times but still not turn the 50 ema)). A turn is defined as more than .2 pips. The market is now in a range and there is no trading this system.
The market is in a "trend" when the 50 ema is up more than .2 pips for 5 consecutive candles after it has been in a range (see above). See picture below
Now that you know what a trend and range is in this system let's go over the buy trade signal:
Buy Signal
1. The trend must be up (see above)
2. Stochastic must be in position to make a hidden div (see picture below) Note:Only compare stochastic levels at fractals, i.e. run your crosshair from fractal down to indicator and see stochastic level, then wait for current price to be higher.
3. Once it is in a position to make the hid. div. wait for a Jap candle formation (doji star, engulfing, piercing line etc...) then let %k (fast line) turn 1 point (stochastic points are plotted 0 to 100) on a candle that closes in its upper half (indicating strength), if the candle stoch %k turns on closes below 50% of its range wait for next candle and %k to move up 1 point again. You now have a signal to trade.
4. When drawing hidden div lines you CAN draw through a peak or valley like I did in the example but when you have to draw a line through (not connecting) there must be a regular div accompanying it.
Note: Reverse for sells (trend must be down and stochastic %k must turn down not up)
Now you must determine how much you are going to risk on this trade. My "base" risk is .75% (seem small? Well change it to your liking I don't care
Other indicators with trade: risk .1% more/less if they are with/against
Steep trend: more than 60 degrees in a trend is a steep trend that is likely to reverse risk .1% less on this trade.
1hour b4 minor news: risk .1% less
Up against daily/weely pivot point: risk .1% less if pivot is blocking trend risk .1% more if it is supporting trend.
You can come up with your own market "factors" and how much to risk for your "base". Note that this is max risk (.75% puts my max risk at 1.15% and my min at .25%).
Here is a step-by-step process to figure out your Limit (to take 1/2 of position off) on the trade (all examples are buy trades):
1) Are the bollingers "pinching" in? If they are use ATR 5 to set your target (1 times ATR 5 value ON SIGNAL CANDLE) this value will have to be added to your entry once it is determined (see "the entry price" below). If they are normal trending bollinger bands (wide and not pinching) revert to steps 2-3
2) Determine whether the signal candle (candle that turned stoch. to make hid. div.) closed within 5 pips or so of the highest DNC upper channel in the trend (use DNC channel to identify this) if it did use ATR 5 to set target (just as above). If not, Revert to step 3.
3) Determine whether the bollinger band is above the highest DNC upper channel level. If it is use DNC upper channel as limit (subtract a pip or two in case price drastically reverses near it which sometimes happens). If the bollinger band is not above the highest DNC upper channel in the trend use bollinger band as first target (minus a few pips)
4) If you could only grab 1 lot (whatever size) on the trade then use a pivot or fib level to exit the 1 lot.
Here is a step-by-step guide to placing stops:
1) Determine your limit (above) and then multiply your limit in pips by two to get your max stop distance if using ATR (for instance use ATR 5 limit because bollingers are pinching putting target 15 pips away) In this example max stop is 30 pips. If not using ATR limit find the nearest fractal and put your stop under there then just find the entry
2) Now that you know your max stop distance find a fractal around that area (not beyond max though) and put it 3 pips below it for all pairs with USD as the last currency in pair (EUR/USD, AUD/USD are examples). 2.5 pips for USD based pairs (USD/JPY, USD/CAD).
3) If there is no fractal (there is 99% of the time) use big bars in the direction of trend for original stop (never exceed max).
4) Now that you know your stop you need to find out how many lots to grab. If your trading mini lots (10,000 of base currency) and your stop is 30 pips which is .5% of your account (you determine that max risk on trade is 1% which is 60 dollars of a 600 dollar account) you then grab 2 lots to equal 60 dollars of risk.
The Entry Price
1) To figure out the entry price you need to know your stop position and your limit size in pips then take a horizontal line and put it at the current market price after the signal candle. See if the stop size is not more than two times the first limit size (remember the first limit takes off 1/2 of the position). Its that simple start with an entry at market, if it lines up with the rules (stop not more than 2 times limit) take it if not move the order until it lines up (as long as the order doesn't want price to come to the high of a sell signal bar or the low of a buy signal bar)
When to Cancel an Entry Order
Cancel the Entry order after either 3 candles pass or price hits your would-be first target if the target is an ATR target I want price to move 1.5 times it before I cancel the order (because I don't want price to retrace that much)
Trailing your Stop:
Now that you know how to find the original stop you must know how to trail it:
1) Once price makes a "clean bar" (bar which opens in lower-third and closes in upper-third and makes a new high since entry) put stop 3 pips below it for pairs with /USD as last symbol or 2.5 pips for pairs with USD/ as first symbol. Also trail stop at every "fractal" also (I have a robot which does this for me if I'm sleeping during which I can't use the clean bar rule, but this is just part of trading)
2) Once first target is hit the stop MUST (doesn't rely on clean bar, or fractal) move to at least half of original risk and at max to breakeven.
3) In the end stop trailing is summed up by this example, in this example green line is entry, lowest red line is original stop while other reds are stop trail, pink is first target (based on ATR since price closed above highest DNC upper channel in trend): See AUD trade below
I will be posting many more examples and youtube videos as I come up with them but here are a few picture examples for now:
See both of these trades below, granted this week's trades got very whipsawed because of indecision wrapped around NFP
Don't worry if this all seems complicated the procedure is actually so easy and I will explain it in detail with a few youtube videos. But be aware that this system is so powerful and it will make great consistent profits (80% of the time it hits the first target). Again I'm not too great with words so just ask me about something and I will try my best to answer it. Thanks for reading about this system I hope you can use this to find hidden wealth.
Attached Image(s) (click to enlarge)