please check bond rates, isn,t portugal offering 10-year bond yields at 7.656. 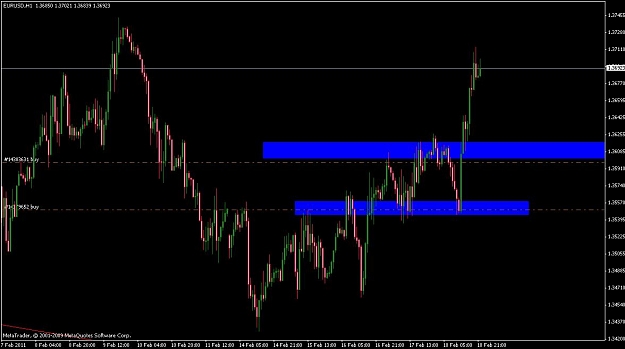
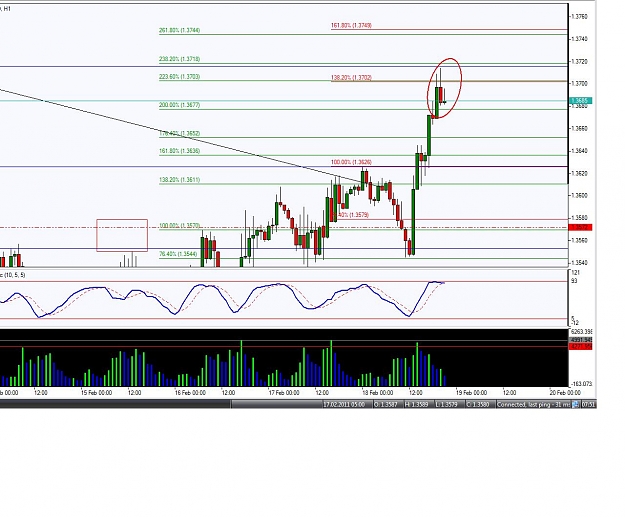
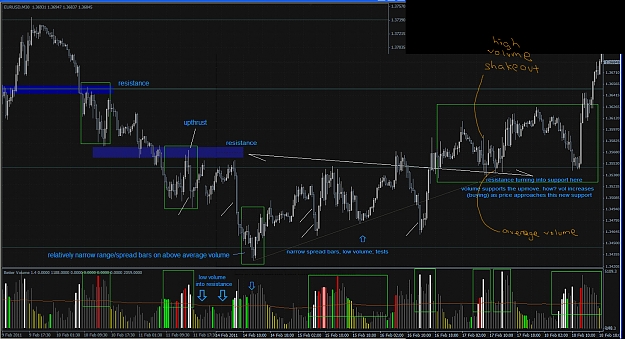
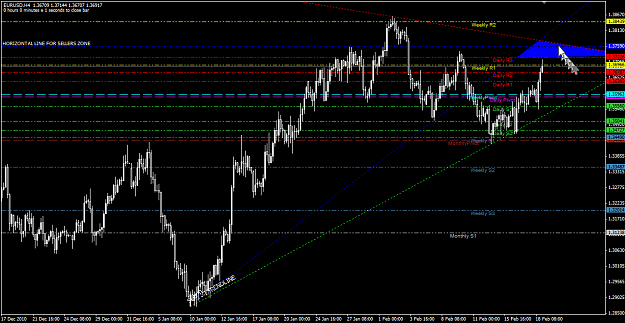
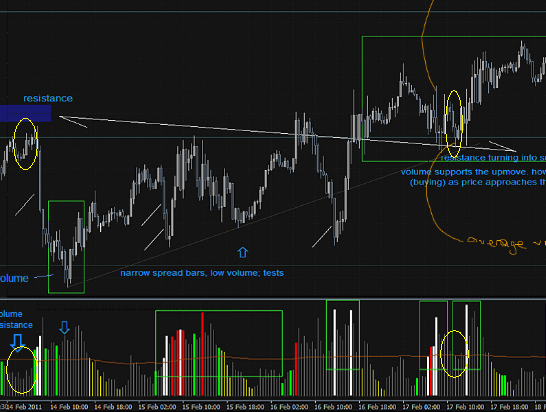
i am currently a bit biased. but i am seeing new yearly highs.
Attached Image (click to enlarge)
i am currently a bit biased. but i am seeing new yearly highs.