who can say where is the price goes when the price flows ... only time 
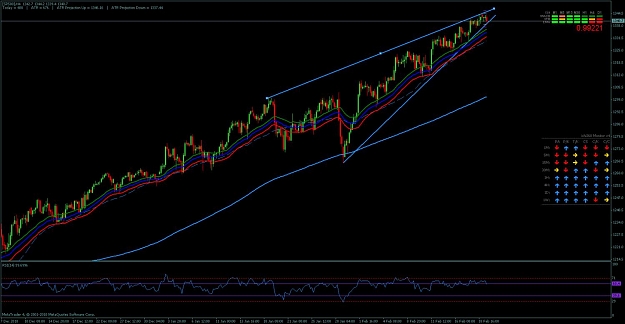
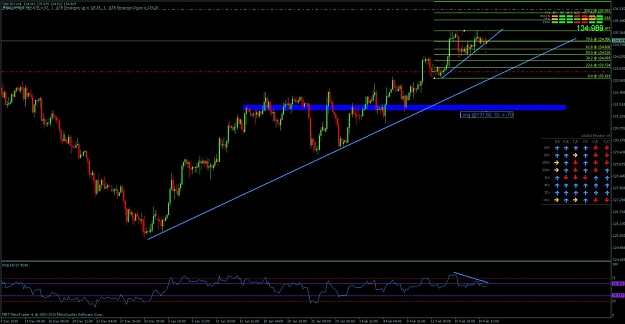
I think at the colored time zone we will see the direction
Inserted Video
I think at the colored time zone we will see the direction
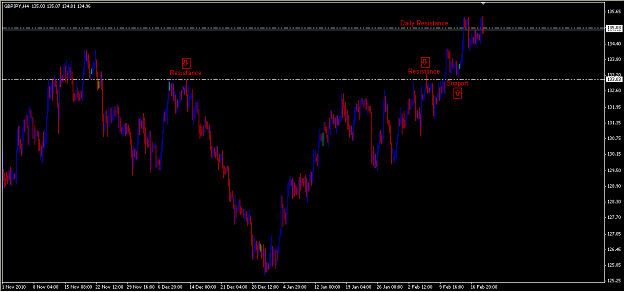
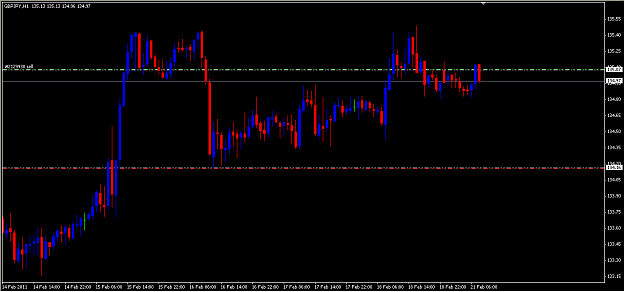
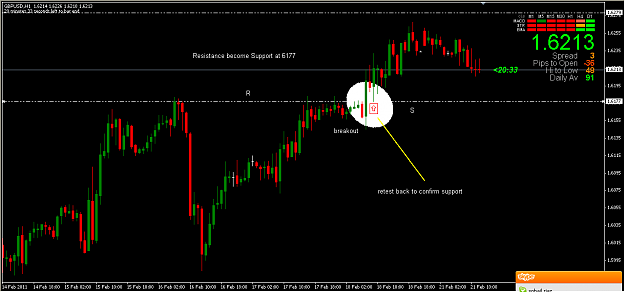
Attached Image (click to enlarge)
Attached File(s)