HI ALL. Some notes about Volatility Indicators [bad English, sorry http://cdn.forexfactory.com/images/icons/icon9.gif ]
Financial Markets Observatory Lab.
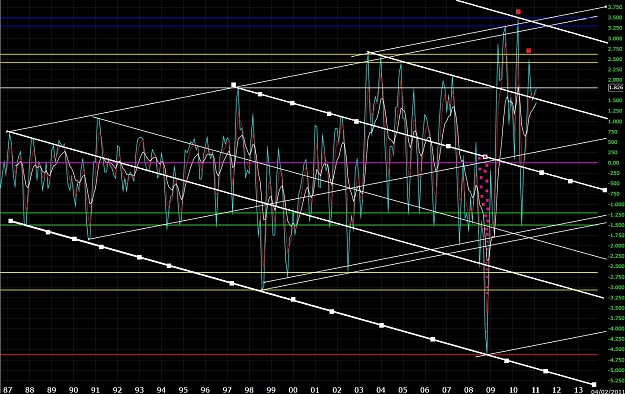
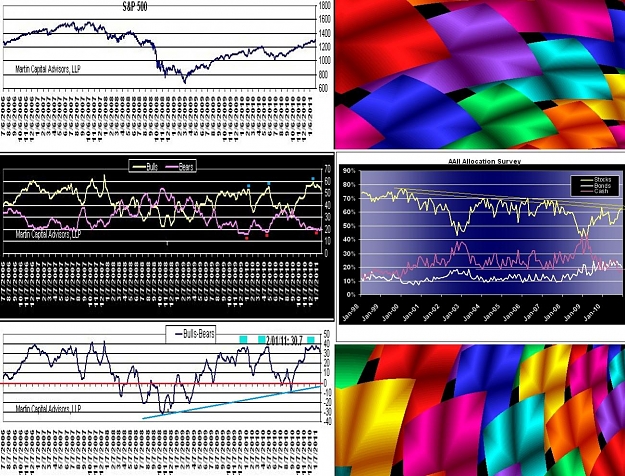
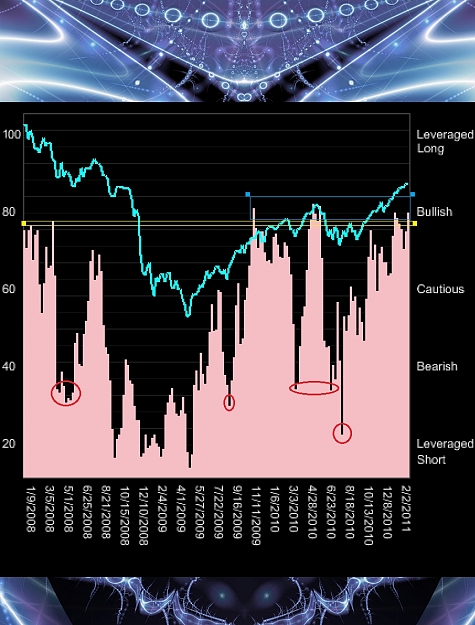
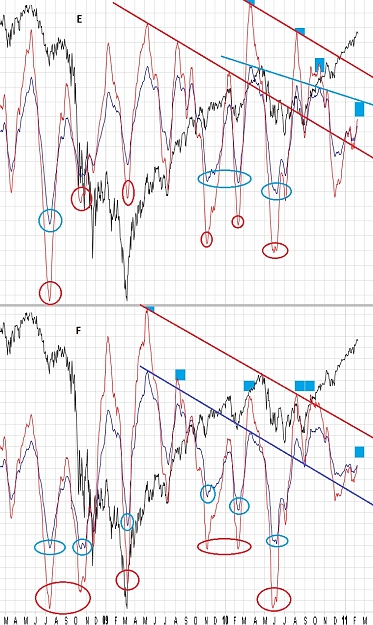
An interesting long-term chart for Volatility Indicator of Nasdaq/100.
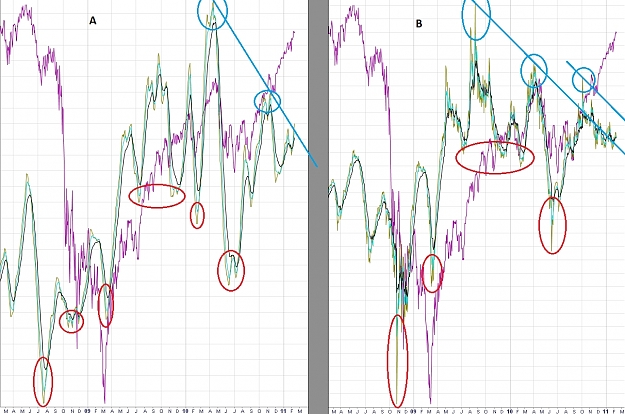
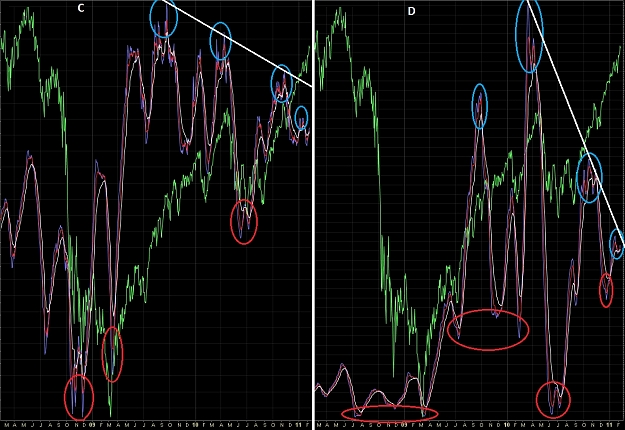
There are some regular patterns (ascending and descending lines) important for long-term picture.
The 2010 preliminary bearish sign of VIX (previous post) is partial verified in VXN.
Below the basal yellow line there will be a probable sell-off in volatility prices.
http://tzgerq.blu.livefilestore.com/...083.jpg?psid=1
Tuned on the megalithic structure in financial market but follows short-medium term trends.
It is very important do not anticipate the main trend of the underlying financial instruments.
I.M.O. by $@!Ψ¥
Financial Markets Observatory Lab.
An interesting long-term chart for Volatility Indicator of Nasdaq/100.
There are some regular patterns (ascending and descending lines) important for long-term picture.
The 2010 preliminary bearish sign of VIX (previous post) is partial verified in VXN.
Below the basal yellow line there will be a probable sell-off in volatility prices.
http://tzgerq.blu.livefilestore.com/...083.jpg?psid=1
Tuned on the megalithic structure in financial market but follows short-medium term trends.
It is very important do not anticipate the main trend of the underlying financial instruments.
I.M.O. by $@!Ψ¥