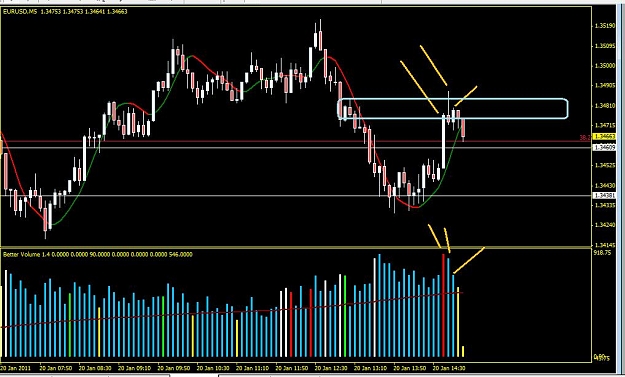
DislikedThe first chart(5m EU) shows the no supply I entered on the break of.
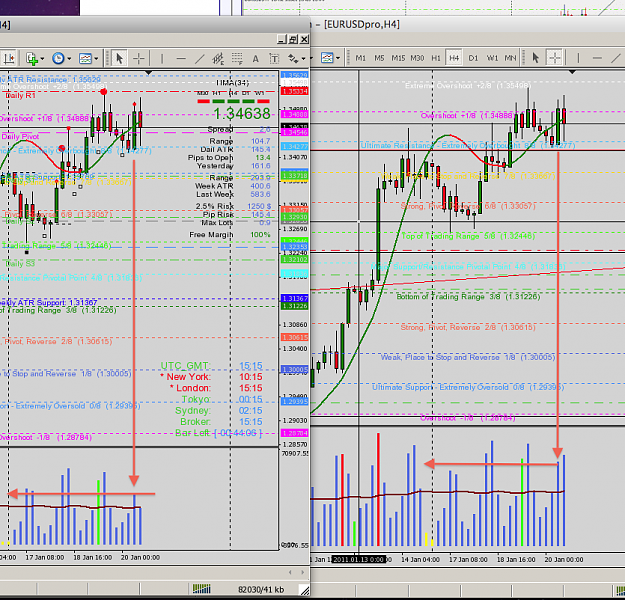
Next is the 15m showing confluence of supply, today's POC, and stopping volume. Last week's high was also right there.
I grabbed profit just before yesterday's POC.
Edit:
The first chart also shows possible selling, good thing to be out.Ignored
Price is hesitating at yesterday's POC, SL to BE at around +10.
Edit:
Stopped at breakeven, we hit very high volume when we bumped into yesterday's POC
Attached Image (click to enlarge)