Sorry -- Doesn't work.
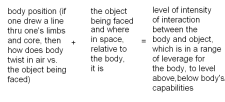
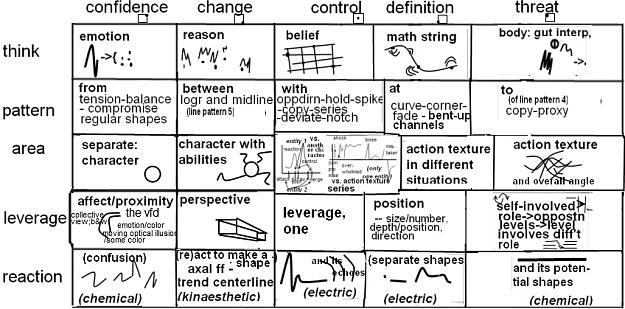
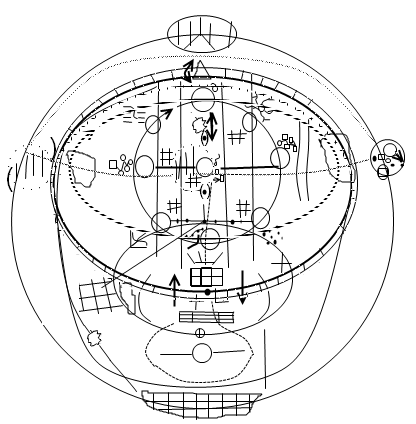
VISUAL FIELD DIAGRAM
(c center; b,d next; a,e edge)
A make, C1 use LIST little p,t
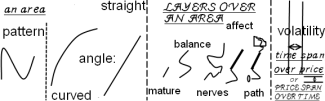
- vague -- pattern/area, series
- absolute -- horizontal, vertical lines
- curved -- angle: logr, 'weak'/strong
- straight -- angle: midline, trendlines
- single -- candles
B LAYER p>t simpler: Act as if a std area IS a pattern and ignore angles for a really wide in-trade drawdown, thus simplifying what put into series --
0427-8 2009, g/u 1'TF it's gonna wander in this area, because lots of paired candles and light opposers are here, whereas it'll visit the lower stuff, which is a bunch of levels, and then leave, because it wants to explore the upper stuff (and see if it can get a level price there); or, as another way to put it, one area has a few horizontal lines and the other, above it, has a bunch of small vertical lines.
Then, all one does is study for a couple of exceptions within each vast area, for the turn's possibility.
Sometimes, I just can't concentrate enough, and relaxing to be a successful trader is far better than pushing myself into being a high-performing one.
This one works okay, and so does angles made to be tiny patterns that continuously fill up areas, allowing for the series to happen. An opposite to the last, to be sure; tougher, since there's lots of angles; and with this, more exact, in an almost lyrical way.
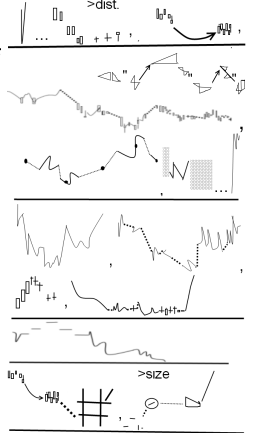
C make, A&E use STRUCTURE lots of p,t The idea is to simplify identification of every area and its structure and projections.
To this, the picture below has a local turn, which produces a line segment for its structure,
and a global level, which produces a line ray for its projection:
Its context is here.
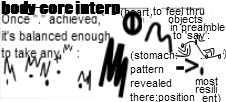
Maybe this need for clarity brings with it justification for leaving unsure trades alone. Deciding through one's own observation of and then entering into a given structure and doing action within it
is completely different than
accepting an entity as having its own inherent structure without challenge and fitting a logical framework upon it for doing action within it:
Same feel, different result. The first is chaos and highly emotional, the second trading and, potentially, highly rational.
A third (/fifth) choice is doing the local (former) AND global (latter) choices, especially if complexly rational.
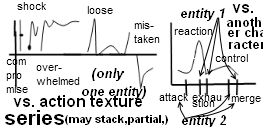
D COMPARE p<t

Use these symbols to compare different versions of them on the chart. Compare -- oppose, flip and oppose; or, for example, one stereotypical shape is wide, complex and develops and thus must be studied further, while the other is narrower and simpler and will respond to the other's actions.
E make, C2 use ATTITUDE little p,t
- THAT'S EXACTLY IT.
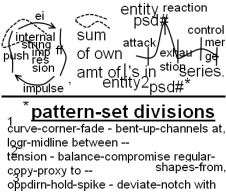
pattern -- locally unique shape, separate from others, next joins - SIMPLIFY AND MULTIPLY!
with o/a curved (including logr) and straight (including midline) tension ( : adds up) angle (sometimes a TL) marking break - WELL, IN THE CONDITION IT'S IN....
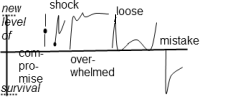
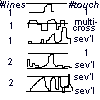
a series -- 1 maturity (has: moves on); 2 balance; 3 nerves; 4 affect; 5 path - IT JUST MOVES SOMEHOW, HERE
period only of space or time bracketing volatility; std area; and, area signifier type of pattern -- looks same, overlaps other, next replaces
(revision)
VISUAL FIELD DIAGRAM
(c center (emotion, kinda);
b,d next (moving optical illusion, kinda);
a,e edge (plain appropriate-social view and activity, kinda))
Angles shrink space!
A
- vague -- pattern/area, series
- absolute -- horizontal, vertical lines
- curved -- angle: logr, 'weak'/strong
- straight -- angle: midline, trendlines
- single -- candles
from
B Act as if a std area IS a pattern and ignore angles for a really wide in-trade drawdown, thus simplifying what put into series --
or
angles made to be tiny patterns that continuously fill up areas, allowing for the series to happen.
______________________________________________________
Balance!
C The picture below has a local turn, which produces a line segment for its structure,
and a global level, which produces a line ray for its projection:
Its context is here.
___________________________________________________________
One fast shrinks time!
D Variation in single instances of
or
Compare -- oppose, flip and oppose, eliminating which to pay attention to along the way.
into
E
- SIMPLIFY AND MULTIPLY!
with o/a curved (including logr) and straight (including midline) tension ( : adds up) angle (sometimes a TL) marking break - THAT'S EXACTLY IT.
pattern -- locally unique shape, separate from others, next joins - WELL, IN THE CONDITION IT'S IN....
a series -- 1 maturity (has: moves on); 2 balance; 3 nerves; 4 affect; 5 path - IT JUST MOVES SOMEHOW, HERE
period only of space or time bracketing volatility; std area; and, area signifier type of pattern -- looks same, overlaps other, next replaces
With this simplified description of my current chart study approach, I begin a journal.
first one,
I used A3. Failed, since forgot it needed a trailing stop to capture the errant 'stronger-logr' reading.
second one,
I used A1 intuitively; this is weak, so I expanded in my mind the significance of space, that is, price*time, and thus, still unconsciously, switched to D and E, at first developing the area as a series of a pattern that rapidly contrast.
Then I realized the anchor at 1638est would level price, and traded it, getting a wide in-trade drawdown.
I don't recall exactly why I did the next trade. Perhaps I felt 1638est was a good resistance, the itd a weak rise that -- as I see now -- opened up a repetition of a zigzag effect. Anyhow, this last one is definitely an after-trade reason. I forget.
Pretrade reasons are easier to deal with and more legit.
Of course.
One thing, it f---in' slops around. I get it right, letting go of my perfectionism after accepting one stinkin' method; it's just that my reasons are approximately right. I gotta laugh at myself.
All the way to the bank, if I keep this going.
journal
12022010 06142009 3.5pctanhr 30h used method w- few tl's, lvging its approx nature -- Thus, no reason to show it, as no one would believe the trade report or see enough on the chart. It's all method.
I've captured the method I've always used, and, having brought it to my consciousness, can keep going even if I lose big. On this last group, I lost one trade for 30% of my original cash, and took four trades to recover; even so, I made it to 1/3 top speed (ten pct an hr (since I use 50-80% of 50:1 leverage) after several more trades.
Well, anyway, I'm happy. So what if I traded on demo simulator.