• Home
  • Forums
  • Trades
  • News
  • Calendar
  • Market
  • Brokers
  • Login
  • Join
  • User/Email: Password:
  • 6:07pm
Menu
  • Forums
  • Trades
  • News
  • Calendar
  • Market
  • Brokers
  • Login
  • Join
  • 6:07pm
Sister Sites
  • Metals Mine
  • Energy EXCH
  • Crypto Craft

Options

Bookmark Thread

First Page First Unread Last Page Last Post

Print Thread

Similar Threads

Is Grid Trading (combined trend following and counter trend) Profitable? 3 replies

Trend following or trend fading? 8 replies

Trend Following Experiment - GBPUSD 26 replies

Trend Following Experiment - EURUSD 80 replies

following the trend 2 replies

  • Trading Discussion
  • /
  • Reply to Thread
  • Subscribe
  • 53
Attachments: Trend Following - A Complete Guide
Exit Attachments

Trend Following - A Complete Guide

  • Last Post
  •  
  • Page 1 23456 16
  • Page 1 234 16
  •  
  • Post #1
  • Quote
  • First Post: Dec 15, 2010 11:15am Dec 15, 2010 11:15am
  •  Micardo
  • | Joined Sep 2006 | Status: Trend Follower | 349 Posts
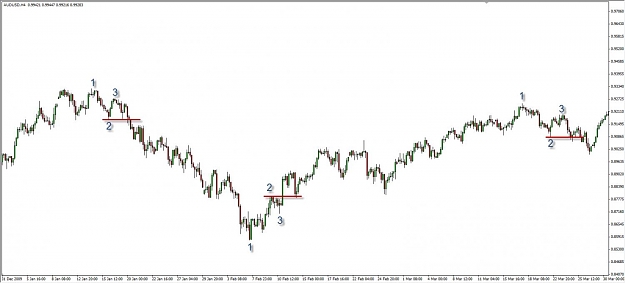
This is a Trend Following system in every respect. It is important to understand that you can see different Trends depending on what Timeframe you are looking at. I trade primarily the Daily and 4hr charts. I also have various ways of entering in the direction of the Trend, these vary from getting in during the early stages of the Trend to entering during pull backs in the Trend. This is why I titled this a complete guide. You should find everything in here that you need to make some money in this business.


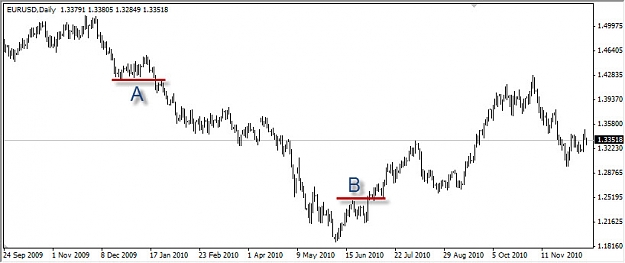
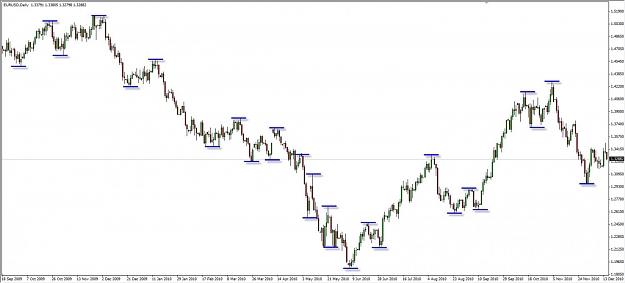
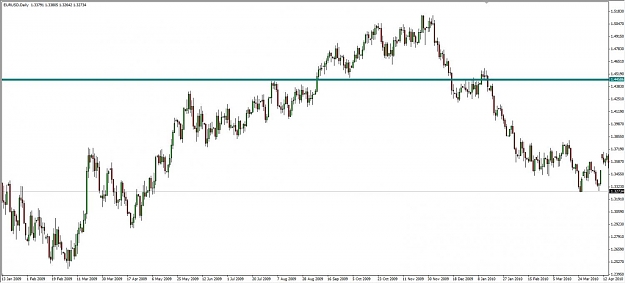
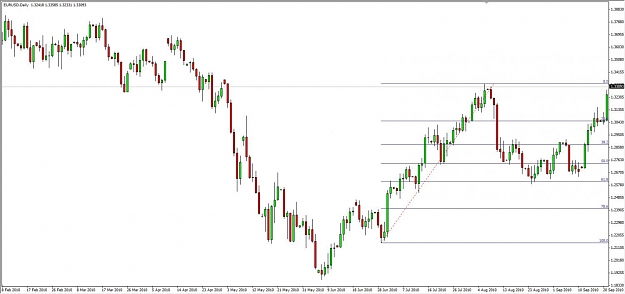
I don't have any specific pair that I like to trade, my only criteria is that the pair is indeed Trending. The only tools I really use are support and resistance, trend lines and fibonacci retracements.


Why share this you may ask? Why not? I spend countless hours in front of the screen everyday (I trade for a living) and it gets boring, so I figured why not speak to like minded individuals. I used to participate on this forum a lot more often than I do now and have learnt bits and pieces from other generous individuals so why not share myself.


I know and fully accept that there are many ways to make money in this business, mine is not the only one and I am certainly not the inventor of the wheel, I have just found what works for me. So there isn't really anything new in here, no holy grail, just a series of systems and approaches.


If you are going to follow this system you have to accept that we are looking for the home runs, the big trends that will make you extremely healthy returns, but to get there you will have to endure a few small losses and break even trades along the way.


We are Trend Followers, if you want to understand trend following better as a concept and philosophy you could read a great book by a guy named Michael Covel its called "Trend Following"


OK so let's get into the approach.
  • Post #2
  • Quote
  • Dec 15, 2010 11:17am Dec 15, 2010 11:17am
  •  Micardo
  • | Joined Sep 2006 | Status: Trend Follower | 349 Posts
I think it is fair to say that the widely accepted definition of a trend is a series of higher highs and higher lows in an uptrend and a series of lower highs and lower lows in a downtrend. There it is logical to say that a break down in a trend would be failure to make a lower low in a down trend or a higher high in an uptrend. Confirmation of the break down would come when price makes a new lower low after failing to make a higher high in an uptrend and when prices makes a new higher high after failing to make a lower low in a downtrend. So what does this look like on a chart?
 
 
  • Post #3
  • Quote
  • Dec 15, 2010 11:18am Dec 15, 2010 11:18am
  •  Micardo
  • | Joined Sep 2006 | Status: Trend Follower | 349 Posts
This is an example from the EUR/USD chart for this year (2010). I have highlighted to points "A" & "B".


A. In this instance if you go back on the chart you will see that price had made been trending upwards for much of the 2nd half of 2009. The point I have highlighted "A" is the point where the trend officially changed from Up to Down. The price made a significant move down followed by an attempt at printing a new high. This high was nowhere near the previous high (a lower high had been made) which should have alerted us to the potential of a trend change. We then would have been ready to take a short position on the break of the support line marked in red. As you can see this yielded a considerable profit as you have looked to ride this all the way down to point "B" which also happens to be our entry signal to go long.


B. Point "B" represents a reversal from a down trend to an uptrend. As one can see after the move down the market rallies a little making a new lower high (as to be expected), however what follows this high is the attempt to make a new low which going on the previous few months should have been lower than the previous low. So what we have here is the first sign of a break down in the previous downtrend. We then would have put in our line of resistance indicated by the red line under "B" and on a break of this level we would have been long.
Attached Image (click to enlarge)
Click to Enlarge

Name: EURUSD Trend Reversal.jpg
Size: 56 KB
 
 
  • Post #4
  • Quote
  • Dec 15, 2010 11:21am Dec 15, 2010 11:21am
  •  Micardo
  • | Joined Sep 2006 | Status: Trend Follower | 349 Posts
The pattern shown in the chart above is also known as a 1-2-3 reversal pattern or an ABC reversal. The name really doesn't matter, what matters is being able to identify the pattern as this pattern is not just going to be used to get into the trend early doors but also as a signal to allow us to jump back into a trade in the direction of the trend after a brief retracement. So just to make sure we are all clear, below you will find a few more examples this pattern.


So just to recap if we are looking for a reversal of an up move we would like to see


1: A higher high
2: A higher or lower low
3: A lower higher


We would then draw in our support line directly beneath point 2 and enter short on a break of this line.


If we want to see a reversal of a down move the opposite is true.


1: A lower low
2: A higher or lower high
3: A high low


We would then draw in our resistance line directly above point 2 and enter long on a break of this line.
Attached Image (click to enlarge)
Click to Enlarge

Name: 123.jpg
Size: 67 KB
 
 
  • Post #5
  • Quote
  • Dec 15, 2010 11:23am Dec 15, 2010 11:23am
  •  Micardo
  • | Joined Sep 2006 | Status: Trend Follower | 349 Posts
OK so that should be enough to get us started. I will come back later to post more about the approach. If you have any questions please feel free to ask.
 
 
  • Post #6
  • Quote
  • Dec 15, 2010 11:24am Dec 15, 2010 11:24am
  •  Winston Reed
  • Joined Mar 2009 | Status: Hobby Trader | 5,785 Posts
I'm trend follower too but often have difficulty getting in on a trend in progress. Looking foward to reading more on your system.
Hobby Trader
 
 
  • Post #7
  • Quote
  • Dec 15, 2010 12:36pm Dec 15, 2010 12:36pm
  •  Micardo
  • | Joined Sep 2006 | Status: Trend Follower | 349 Posts
Support and Resistance is for me the most powerful tool any trader can have. It shows you exactly who is or has been in control at particular areas on the chart. For the reason you also know that 8 times out of ten there is going to be some sort of reaction at these levels. The price is either going to bounce off of these levels or break through making new highs or lows.


Support is to be looked upon as a floor for the market, it is a point where the market failed to go any further down and either bounced or consolidated.


Resistance is to be looked upon as a ceiling for the market, it is a point where the market failed to climb any higher and again either bounces or consolidates.


So how do we identify Support and Resistance levels? we simply look for the most obvious levels on the chart. Check out the examples below.
Attached Image (click to enlarge)
Click to Enlarge

Name: Support and Resistance.jpg
Size: 74 KB
 
 
  • Post #8
  • Quote
  • Dec 15, 2010 12:47pm Dec 15, 2010 12:47pm
  •  Micardo
  • | Joined Sep 2006 | Status: Trend Follower | 349 Posts
Now another known fact is that a previous level of support can become resistance in the future as can a previous level of resistance become support at some point in the future. This single piece of information can be used to find profitable trading opportunities. With this piece of information we know that if we have a strong trend then a retracement to such a level is likely to produce a bounce and resumption of the main trend. We therefore draw these levels on our charts in anticipation of such price behaviour so we know where to expect a reaction and resumption in the trend after a brief bout of profit taking.


It is also important to note that these levels should not be used as to the pip levels, but more as zones where it is logical to expect price to react. So even if we get the desired price action a few pips before or after the support or resistance level, we still trade it accordingly as we are not looking for a to a the pip reaction, just a reaction in that area.


The chart below demonstrates this behaviour.
Attached Image (click to enlarge)
Click to Enlarge

Name: Support and Resistance Zone.jpg
Size: 81 KB
 
 
  • Post #9
  • Quote
  • Dec 16, 2010 5:44am Dec 16, 2010 5:44am
  •  winalot
  • | Joined Jul 2010 | Status: Member | 98 Posts
Hi Micardo,

Thanks for taking the time to start this thread. I have been trading for about 2 years, mostly scalping. I would really like to learn more about trading on longer term charts. What you have shared so far is very simple and clear. You are doing a great job of illustrating your information in a way that is very easy to understand.

Please keep up the good work. I am following every post with eager expectation!
 
 
  • Post #10
  • Quote
  • Dec 16, 2010 6:17am Dec 16, 2010 6:17am
  •  roundrock
  • | Joined Feb 2010 | Status: J16 Student | 902 Posts
nice explanation. thanks for starting this thread

can you post any live examples on any timeframe ? to illustrate the concepts...
 
 
  • Post #11
  • Quote
  • Dec 16, 2010 4:23pm Dec 16, 2010 4:23pm
  •  Winston Reed
  • Joined Mar 2009 | Status: Hobby Trader | 5,785 Posts
Enjoying the new thread. Would be great to see you use presented information so far and apply to a currency pair as it stands right now.
Hobby Trader
 
 
  • Post #12
  • Quote
  • Dec 17, 2010 5:29am Dec 17, 2010 5:29am
  •  vijidas
  • | Joined Aug 2010 | Status: Member | 131 Posts
Hello Micardo,

I'm looking forward to this thread. I personally think the real difficulty in mastering trend trading is the timeframe.

for example: An uptrend in 4 hours may not be uptrend in daily. So it makes it extremely difficult to master and trade trend trading.

I hope you could guide us with this and share with us charts, examples and any rules you trade.

I trade S&R, Trendlines and Fibs only. But still rough around the edges and struggle for confirmation. Looking forward to your posts.

thanks
 
 
  • Post #13
  • Quote
  • Dec 17, 2010 6:47am Dec 17, 2010 6:47am
  •  Micardo
  • | Joined Sep 2006 | Status: Trend Follower | 349 Posts
OK so we have already discussed support and resistance in its most basic form. Now I want to speak about another form of support and resistance - Fibonacci retracements.

These are also levels where we would expect price to react, of course we don't ever guess we just react to the price itself. So we use Fibonacci retractements in much the same way as we use normal support and resistance. If price starts to bounce off of one of these levels we would look for our entry signal (candlesticks or price action - we will come to that later).

Now one of the major problems with Fibonacci as a tool is that it is really subjective. I can draw in the levels one way and 10 other traders may draw them in 10 other different ways. So with this in mind we don't want to use these levels in isolation, we want to use them in conjunction with other formss of support and resistance, again we will come to that later.

So lets just quickly define how I draw them in... In an uptrend I will start at the most recent swing low and connect it to the most recent swing high.

In a down trend I will start at the most recent swing high and connect it to the most recent swing low.

The chart below should really demonstrate this.
Attached Image (click to enlarge)
Click to Enlarge

Name: Fibonacci.jpg
Size: 83 KB
 
 
  • Post #14
  • Quote
  • Dec 17, 2010 6:55am Dec 17, 2010 6:55am
  •  Micardo
  • | Joined Sep 2006 | Status: Trend Follower | 349 Posts
Quoting vijidas
Disliked
Hello Micardo,

I'm looking forward to this thread. I personally think the real difficulty in mastering trend trading is the timeframe.

for example: An uptrend in 4 hours may not be uptrend in daily. So it makes it extremely difficult to master and trade trend trading.

I hope you could guide us with this and share with us charts, examples and any rules you trade.

I trade S&R, Trendlines and Fibs only. But still rough around the edges and struggle for confirmation. Looking forward to your posts.

thanks
Ignored
Hi Vijidas,

You are correct about the timeframe as you can have different trends on different timeframes. I think the most important thing is to understand this and know where you are in the bigger picture at all times. So if you are trading the 4 hour that is fine, but just make sure you know whether you are trading in the direction of the major trend on the daily or the counter trend. This will keep you out of trouble.

I will try my best to help everyone out here, don't worry :-).

The othert aspect that is difficult about trend trading is the Psychology, with trend trading you will have a lot of B/E and some losses and you really have to deal with that as you need these in order to get the big trends. The secret is to keep your losses small enough so that when the big trend comes you make up all your losses annd then some. For example I have had a period where I had more than 10 trades in a row that have been mainly break even with one or two losses and one or two smaller profitable trades. All of these trades in total set my account back -0.5%.

So my losses are small enough so that when the big win comes it really takes care of these consolidation periods.

Anyway I am going off on a tangent here... I will come back and address all of these points later on.

Back to the approach :-)
 
 
  • Post #15
  • Quote
  • Dec 17, 2010 6:56am Dec 17, 2010 6:56am
  •  Micardo
  • | Joined Sep 2006 | Status: Trend Follower | 349 Posts
Sorry and in answer to everyone elses comments, yes I will certainly post charts etc to give you live examples, but first I want to get the approach and philosophy down so that we are all on the same page and when you look at the charts you know exactly what I am talking about.

I hope that is ok.
 
 
  • Post #16
  • Quote
  • Dec 17, 2010 7:04am Dec 17, 2010 7:04am
  •  thokthok
  • | Joined Dec 2010 | Status: Member | 71 Posts
What about news? Does that have any effect on your trades.
For example, if you have any open position in fiber, have you adjusted it according the recent news of Euro-countries meeting?
 
 
  • Post #17
  • Quote
  • Dec 17, 2010 7:54am Dec 17, 2010 7:54am
  •  Chango
  • | Joined Aug 2006 | Status: Member | 17 Posts
Micardo, thanks so much for taking the time to share your experience with us. I'm looking forward to your future posts.
 
 
  • Post #18
  • Quote
  • Dec 17, 2010 8:15am Dec 17, 2010 8:15am
  •  [email protected]
  • | Joined Oct 2007 | Status: piphunter | 151 Posts
Thanks,

i trade rice action only and it always helps to get other proples point if view so will be watching this thread with interest

Paul
 
 
  • Post #19
  • Quote
  • Dec 17, 2010 8:16am Dec 17, 2010 8:16am
  •  [email protected]
  • | Joined Oct 2007 | Status: piphunter | 151 Posts
sorry meant price action not rice action lol
 
 
  • Post #20
  • Quote
  • Dec 17, 2010 12:00pm Dec 17, 2010 12:00pm
  •  JayTrader
  • | Joined May 2010 | Status: Always Learning | 534 Posts
Good Stuff Micardo, I trade close to same way. I look forward to reading and participating in your thread in the New Year.
Take Care
Jay
Quoting Micardo
Disliked
Sorry and in answer to everyone elses comments, yes I will certainly post charts etc to give you live examples, but first I want to get the approach and philosophy down so that we are all on the same page and when you look at the charts you know exactly what I am talking about.

I hope that is ok.
Ignored
Always Learning
 
 
  • Trading Discussion
  • /
  • Trend Following - A Complete Guide
  • Reply to Thread
    • Page 1 23456 16
    • Page 1 234 16
0 traders viewing now
  • More
Top of Page
Forex Factory Blog Updated: Alerting All Members
  • Facebook
  • Twitter
About FF
  • Mission
  • Products
  • User Guide
  • Media Kit
  • Blog
  • Contact
FF Products
  • Forums
  • Trades
  • Calendar
  • News
  • Market
  • Brokers
  • Trade Explorer
FF Website
  • Homepage
  • Search
  • Members
  • Report a Bug
Follow FF
  • Facebook
  • Twitter

FF Sister Sites:

  • Metals Mine
  • Energy EXCH
  • Crypto Craft

Forex Factory® is a brand of Fair Economy, Inc.

Terms of Service / ©2022