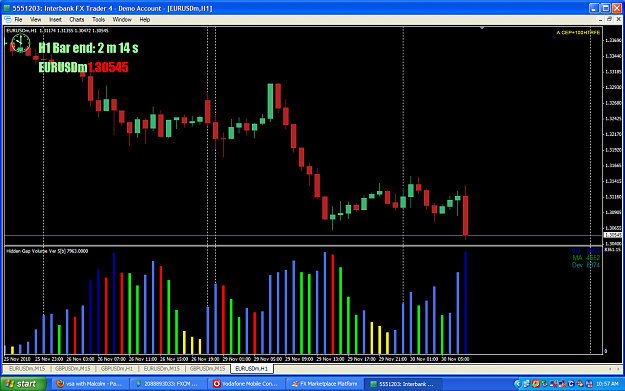
The chart is during a horrible illiquid trading day and your looking for longs in a solid down-trending market. Thats about it. Now back to Modern warfare.
Ignored
Are any of the annotations on the 2nd chart wrong according to VSA?
If so, please explain.
am beginning to think the News as nothing to do
with anything..lol
Ignored
Last week all news were ignored...drivers were Ireland and NK...Market sometimes use news as a vehicle to apply basic and most important law of supply and demand.
The trouble with trading live is that there is always another way to view the action, especially if you're not reading the chart correctly
What do we see this time around?
Ignored
The issue with the 2 bars where you said buyers coming in is that they are both high volume down bars , closing on the lows with the next bars lower... so this is more supply in the market than buyers.
Last week all news were ignored...drivers were Ireland and NK...Market sometimes use news as a vehicle to apply basic and most important law of supply and demand.
Ignored
Got that Right !! am Yet to see SM trade against themselves . For those that
believe News events are driving the charts and not the other way around - For
every Major event that happens ( u know, the event that u think caused the Major move)
All you need to do , is to look back Just a few bars and Bingo , it's Right there-
the Real cause for the move--Like i said " am Yet to see SM's trade against themselves "
Ok. The second chart was wrong. Where I said there were buyers, I should have said there were POSSIBLY buyers but there turned out to be very little if any. Once you realise that the ultra high volume bars resulted in lower prices with no attempt to raise price at all, then the whole scenario changes. What once looked like a reasonable long setup, now looks short all the way.
The moral of this story is that if you want to enter the market, the background HAS to be in your favour. Just one simple missread of the charts would have you joining the weak holders.
This was just an exercise to show how easy it is to get it wrong.
If I'm reading your chart correctly, all your marked (peak) bars are getting hit by sellers - pros (and others) sell into strength. You can deduce this by the next bar(s) being down bars, so you know the volume was made up of sellers overwhelming buyers and the uptrend. Some minor buying support on the lower bars, but when you interpret the background of the visible chart and where we've come from, sellers are firmly in charge.
Could someone please post a 1h EU chart? On IBFX I have very high volume at yesterday's lows. Just want to confirm. If it's right, we might have an up day today.
Could someone please post a 1h EU chart? On IBFX I have very high volume at yesterday's lows. Just want to confirm. If it's right, we might have an up day today.