• Home
  • Forums
  • Trades
  • News
  • Calendar
  • Market
  • Brokers
  • Login
  • Join
  • User/Email: Password:
  • 8:35pm
Menu
  • Forums
  • Trades
  • News
  • Calendar
  • Market
  • Brokers
  • Login
  • Join
  • 8:35pm
Sister Sites
  • Metals Mine
  • Energy EXCH
  • Crypto Craft

Options

Bookmark Thread

First Page First Unread Last Page Last Post

Print Thread

Similar Threads

Looking for compression breakout indicator 16 replies

Time Compression Trading: Exploiting Multiple Time Frames in Zero Sum Markets 9 replies

Project Omega: What is this ? 6 replies

My project over the year/years.... 21 replies

  • Trading Discussion
  • /
  • Reply to Thread
  • Subscribe
  • 22
Attachments: Compression Project
Exit Attachments
Tags: Compression Project
Cancel

Compression Project

  • Last Post
  •  
  • 1 Page 2
  • 1 Page 2
  •  
  • Post #21
  • Quote
  • Oct 20, 2010 3:26pm Oct 20, 2010 3:26pm
  •  techno79
  • | Joined Dec 2006 | Status: Junior Mint | 285 Posts
Quoting Alihuzaifa
Disliked
gosh I dont think too much physics is required for trading
Ignored
Maybe not required, but someone correct me if I'm wrong, I believe there are physicists out there working for the banks. We have them were I'm at doing studies trying to figure out traffic jams!
If someone told me about all this stuff when I was in college picking a major....sigh

Good question about moving stoploss to even. I asked myself this yesterday as well. I think most people scale their profits, so they close half and keep half open with the stoploss at B/E to not exit too early. Otherwise, it did kick me out a few times yesterday too early, but prevented heavy loss.
 
 
  • Post #22
  • Quote
  • Nov 8, 2010 3:36am Nov 8, 2010 3:36am
  •  robdee
  • Joined Jul 2006 | Status: Mighty Mooloo Country | 480 Posts
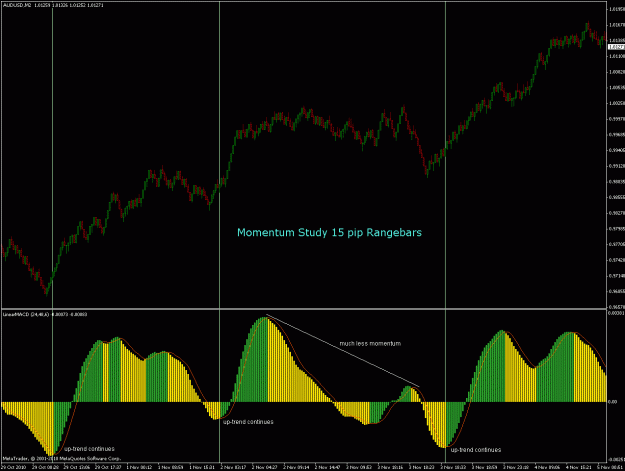
Are all indicators better on constant rangebars - seems like it...

Attached Image (click to enlarge)
Click to Enlarge

Name: momentum-audusd-m2-20101108.gif
Size: 29 KB


Attached Image (click to enlarge)
Click to Enlarge

Name: momentum-eurusd-m2-20101108.gif
Size: 32 KB


Attached Image (click to enlarge)
Click to Enlarge

Name: momentum-gbpusd-m2-20101108.gif
Size: 34 KB


remember to keep clicking on the thumbnail until you see a clear full-size image, in my forefox browser I have to click three times
 
 
  • Post #23
  • Quote
  • Nov 8, 2010 4:00am Nov 8, 2010 4:00am
  •  fxpilot
  • | Joined Aug 2008 | Status: Surf The Waves | 177 Posts
Great thread. The application of physics to trading seems logical with terms such as momentum, support, resistance etc. Signing up.
 
 
  • Post #24
  • Quote
  • Edited 1:34pm Nov 9, 2010 1:22pm | Edited 1:34pm
  •  robdee
  • Joined Jul 2006 | Status: Mighty Mooloo Country | 480 Posts
I use SP500 futures as a general barometer of risk-ON vs risk-OFF in the global markets. This is roughly the inverse of the USD index. Risk-OFF (flight-to-safety) usually means a flow back into USD and YEN. This observation is important for me to understand what is driving exchange rates.

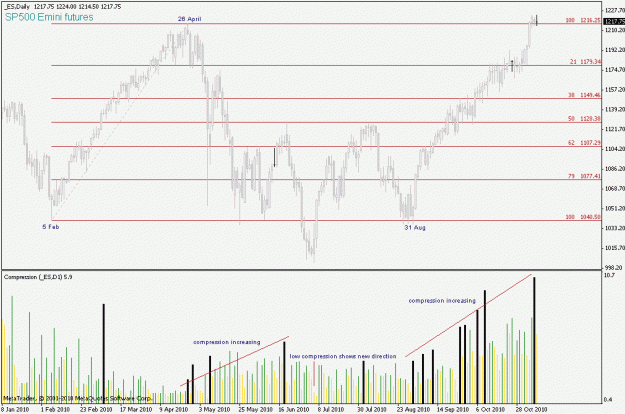
The chart below shows how compression increases as a move progresses. In other words more and more volume is required to move price as opposition is encountered. More energy or effort is being compressed into smaller ranges with less results.

By contrast, when most everyone is in agreement about a new direction there is much less opposition and this shows in low compression scores.

Attached Image (click to enlarge)
Click to Enlarge

Name: compression-es-d1-20101109.gif
Size: 24 KB


After 31-Aug you can see we have had a 2 month risk-ON direction, the dollar weakening, and pretty much everything else strengthening. I am watching now for a new direction confirmed by low compression scores.
 
 
  • Post #25
  • Quote
  • Dec 1, 2011 12:38pm Dec 1, 2011 12:38pm
  •  robdee
  • Joined Jul 2006 | Status: Mighty Mooloo Country | 480 Posts
Quoting robdee
Disliked
I use SP500 futures as a general barometer of risk-ON vs risk-OFF in the global markets. This is roughly the inverse of the USD index. Risk-OFF (flight-to-safety) usually means a flow back into USD and YEN. This observation is important for me to understand what is driving exchange rates.
Ignored
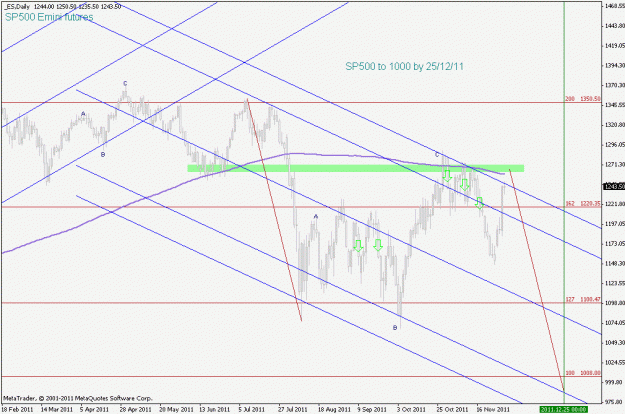
SP500 futures (ES) daily chart. If the down channel holds this rally then a drop to 1000 is possible before the end of this year.

Attached Image (click to enlarge)
Click to Enlarge

Name: es-daily-20111202.gif
Size: 23 KB
 
 
  • Post #26
  • Quote
  • Dec 4, 2011 10:05am Dec 4, 2011 10:05am
  •  redsword11
  • Joined Nov 2008 | Status: living deliberately | 11,122 Posts
http://www.forexfactory.com/showthre...30#post4484730


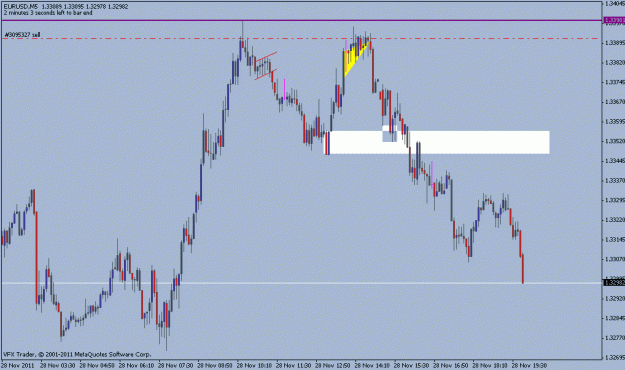
my goodness, you have made this far more complicated than need be


explanation is above, exactly why prices behave in the manner they do within the compression stage and why prices react in the manner they do once compression is complete


Attached Image (click to enlarge)
Click to Enlarge

Name: com.gif
Size: 16 KB


Attached Image (click to enlarge)
Click to Enlarge

Name: com liquidty.gif
Size: 21 KB


Attached Image (click to enlarge)
Click to Enlarge

Name: cable com.gif
Size: 17 KB


a few examples


http://www.forexfactory.com/showthre...288142&page=73
 
 
  • Post #27
  • Quote
  • Dec 4, 2011 10:22am Dec 4, 2011 10:22am
  •  redsword11
  • Joined Nov 2008 | Status: living deliberately | 11,122 Posts
Quoting redsword11
Disliked
http://www.forexfactory.com/showthre...30#post4484730


my goodness, you have made this far more complicated than need be


explanation is above, exactly why prices behave in the manner they do within the compression stage and why prices react in the manner they do once compression is complete


Attachment 848223

Attachment 848224

Attachment 848225

a few examples


http://www.forexfactory.com/showthre...288142&page=73
Ignored

Attached Image (click to enlarge)
Click to Enlarge

Name: ec.gif
Size: 11 KB


Attached Image (click to enlarge)
Click to Enlarge

Name: ccom.gif
Size: 14 KB


Attached Image (click to enlarge)
Click to Enlarge

Name: dow1.gif
Size: 10 KB


Attached Image (click to enlarge)
Click to Enlarge

Name: dow2.gif
Size: 9 KB


....... and a few more from friday NFP
 
 
  • Post #28
  • Quote
  • Dec 14, 2011 9:13pm Dec 14, 2011 9:13pm
  •  robdee
  • Joined Jul 2006 | Status: Mighty Mooloo Country | 480 Posts
Quoting robdee
Disliked
SP500 futures (ES) daily chart. If the down channel holds this rally then a drop to 1000 is possible before the end of this year.
Ignored
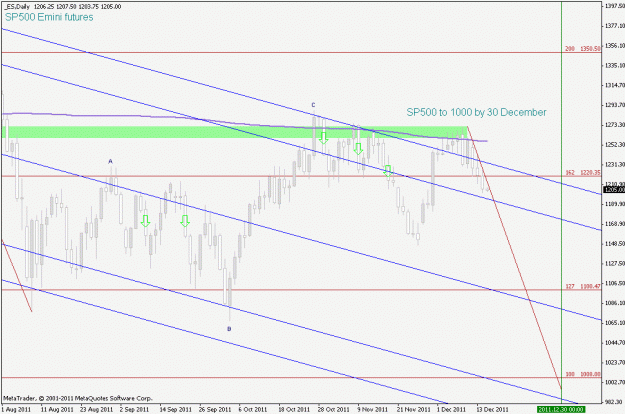
Well it took nine days of testing but the upper side of the down-channel held the SP500.

The last four days are tracking on the same angle as previous steep descents.

Just two weeks remain to reach my estimate of 1000 by the end of the year. August's big fast drop to the channel floor is being used to provide the slope and vertical size for my estimate.

Attached Image (click to enlarge)
Click to Enlarge

Name: es-daily-2011.12.15.gif
Size: 20 KB

Keep clicking on this chart until you see the full size image.
It takes me three clicks in Firefox to see full size.

Robdee
 
 
  • Post #29
  • Quote
  • Last Post: Jan 13, 2014 6:58am Jan 13, 2014 6:58am
  •  wongpasar
  • | Joined Jan 2014 | Status: Member | 27 Posts
such a great thread..
why not keep continue this method..??
 
 
  • Trading Discussion
  • /
  • Compression Project
  • Reply to Thread
    • 1 Page 2
    • 1 Page 2
0 traders viewing now
Top of Page
  • Facebook
  • Twitter
About FF
  • Mission
  • Products
  • User Guide
  • Media Kit
  • Blog
  • Contact
FF Products
  • Forums
  • Trades
  • Calendar
  • News
  • Market
  • Brokers
  • Trade Explorer
FF Website
  • Homepage
  • Search
  • Members
  • Report a Bug
Follow FF
  • Facebook
  • Twitter

FF Sister Sites:

  • Metals Mine
  • Energy EXCH
  • Crypto Craft

Forex Factory® is a brand of Fair Economy, Inc.

Terms of Service / ©2023