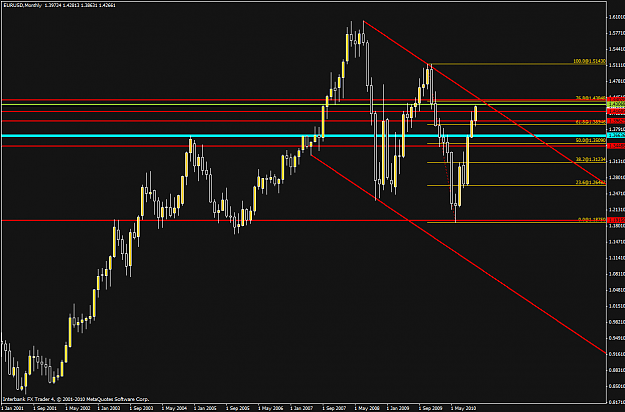
Not really VSA but looking to sell EU @ around 1.44. There's a fib and a horizontal s/r. 1.45 would be a channel top. Of course will be looking for valid VSA setups.
there was the stopping vol and the long right off support ...took 80 and trailing stop on other other , thinking gu 1.6400 to 1.6500 next week and es 1250 or higher
How's that possible. IBFX's volume on that candle is less than on previous candle. Yours is higher already on that last red candle. Damn. I thought IBFX is reliable.
That candle's spread is less than previous while volume is almost the same. That should give you some heads up. Because if volume is the same and the spread is less on the down move, then it means buyers must be active at that time. Doesn't always work, but that's the logic. And don't forget to look at the trend!
That candle's spread is less than previous while volume is almost the same. That should give you some heads up. Because if volume is the same and the spread is less on the down move, then it means buyers must be active at that time. Doesn't always work, but that's the logic. And don't forget to look at the trend!
Ignored
More accurate would have been if the last candle would have closed in the middle or near top? Anyways, I was talking about difference between Mal's chart volume and IBFX's. It has been almost the same, but now ... strange . Maybe IBFX didn't want to show that it was stopping
How's that possible. IBFX's volume on that candle is less than on previous candle. Yours is higher already on that last red candle. Damn. I thought IBFX is reliable.
Ignored
Why not use the tradeintercepter link that was posted here, free on demo and has bettervol indi and hlc bars.
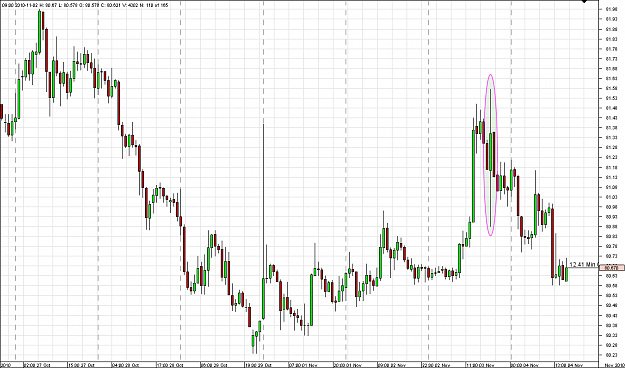
which volume bar and candle indicated that the fall will take place and continue downwards ?
Ignored
better question would be why the price wouldnt go further down ..
as the high volume wide spread down bar , was an effort to go down showing no result .. ie. the market is still reluctant to go down... the next bar shows that there is still supply swamping demand.. but .. thats probably cause by the shakeout .... people sold there long positions as they are scared .. by the wide spread down bar....
so waiting time .. and watching wahts up next...
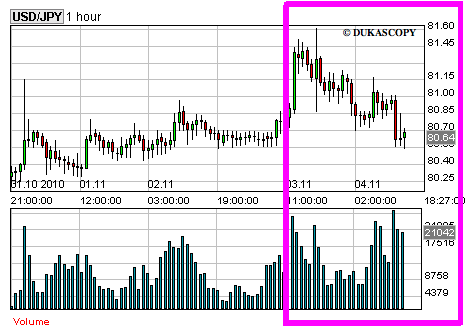
also we are on a support line at 80.60 ...
Ignored
thank you very much for ur reply . will reflect on what u have said.
my earlier question was to do a post-mortem on the drop from the top to the current position (the pink box ) ... was there any indication volume bar/candle-vise that it had reached the peak and will roll downwards to the current position ?