DislikedI mentioned this earlier .. 30 min charts shows buying and here is 60 min
we have low volume testing of last weeks weekly low in the 3730 area
There is also a strong bull div in rsx .... vsa and rsx combo ..wham wham
I will be looking for shake out in asia and potential buy in late asia / frankie for move back to 3850 to 3900
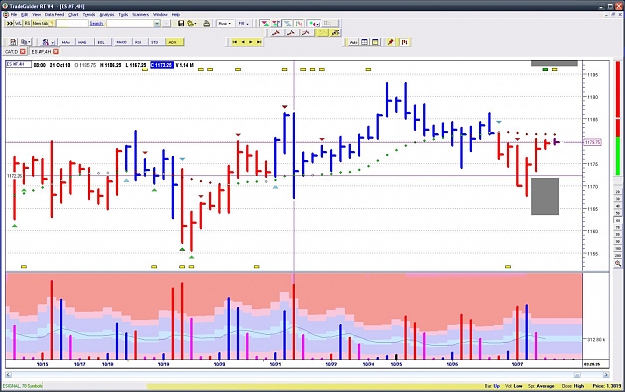
ES was fornt run agian with pomo tomorrow. it had strong stopping vol 1168 and ended day at 1180 .
AttachmentIgnored
How do you detect stopping volume. Sometimes I notice high vol bars while the price keeps going in the same direction before finally retreating. Sometimes I notice the same kinda bar but it shifts this time and a new trend is formed!
I also noticed looking at history that during big crashes or big up days that even many high stopping volume sessions don't cause the currency to change direction until one final really high volume session. How do you know if we are in that kind of trend the will keep going in the same direction? Looking more on H1/H4 time frames. See the crash of 2008 and even pre flash crash.
Normal times you can pinpoint a trend change just by looking at high volume bars. Usually if its on a dip its buying and if its on a peak its selling... but whats the psychology behind this and why does it not work always?
Probably missing a rule.