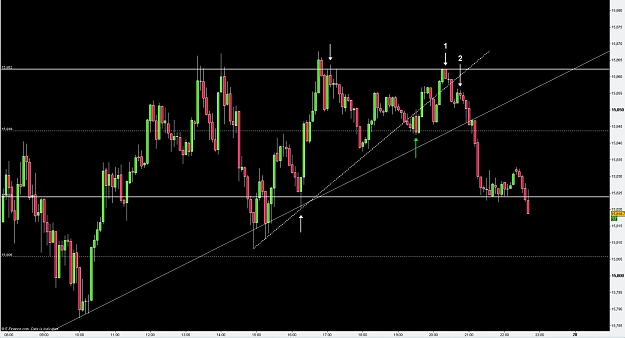
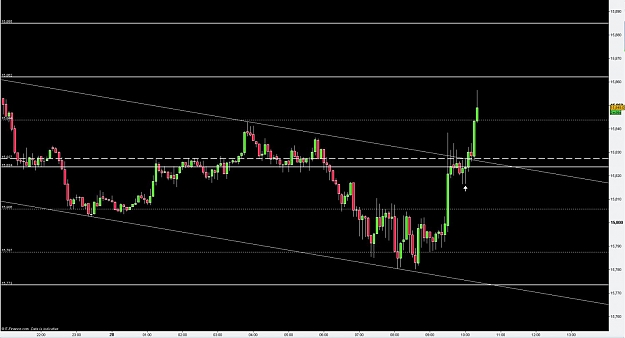
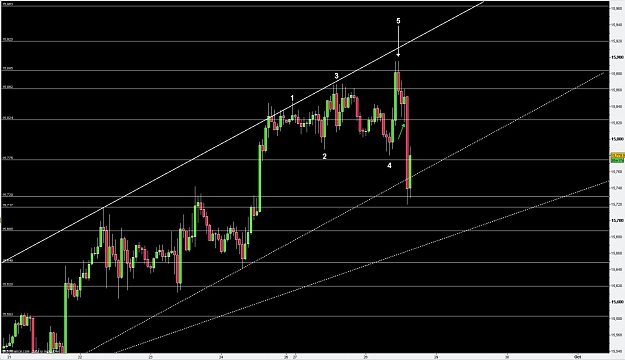
DislikedThis TL was not shown on 1st chart there were two TL coinciding for the 1st trade and the second one was close to the 15844 that why I would have been very carefull of the 15844 area on the short.
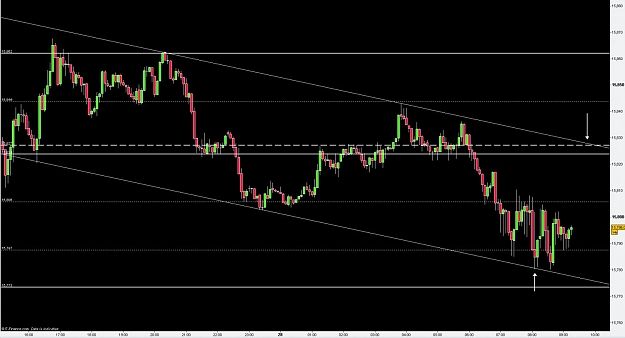
Chart below with other TL on.Ignored
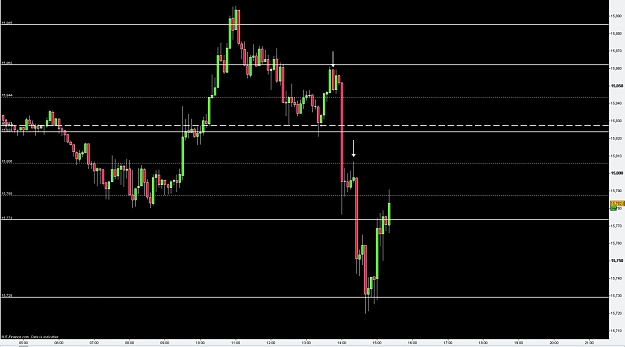
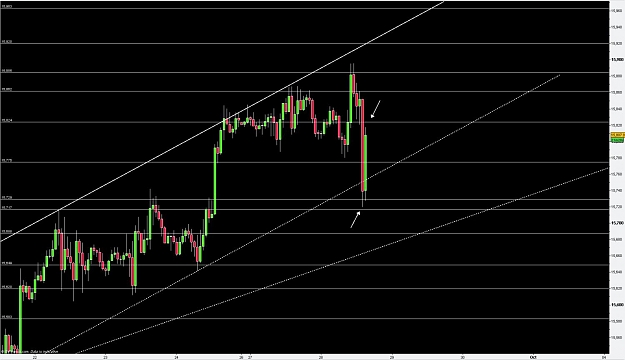
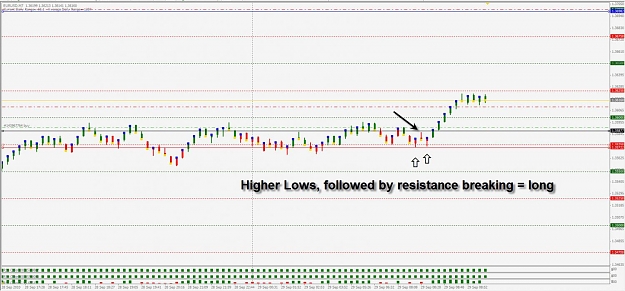
After this price came down to the 15844 area again and broke the TL (green arrow) this to me is a sign of weakness when the TL couldn't hold but there is usually a test of old extreme before the direction changes the test came at the H1 S/R at 15862 the area the 1st short was took off of earlier. After the test at No.1 on chart you had a LH to enter on at No.2 at an extreme and key area.
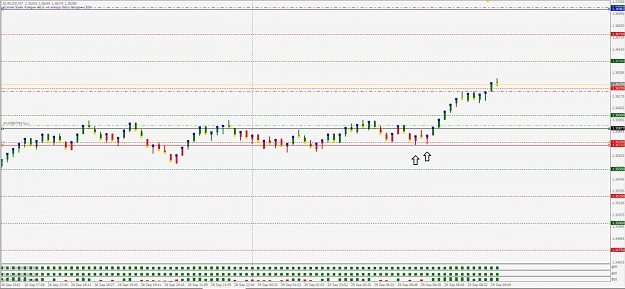
After the TL break at the green arrow showing weakness then the failure to breakout of 15862 target on this would then be 15824 (next H1 support) obviously again being carefull of 15844 still but didin't struggle to much to break it. and after it did break 15844 price went staright to target and ranged for a while.
I should have slept in this morning and traded NY instead lol.
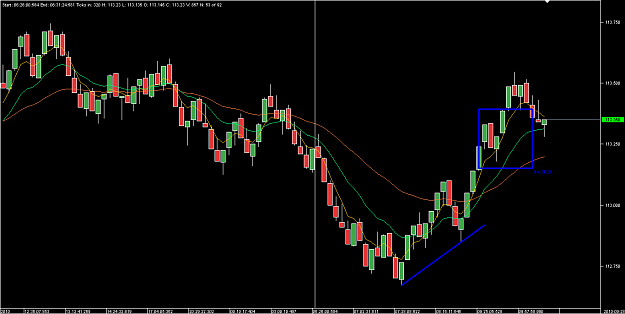
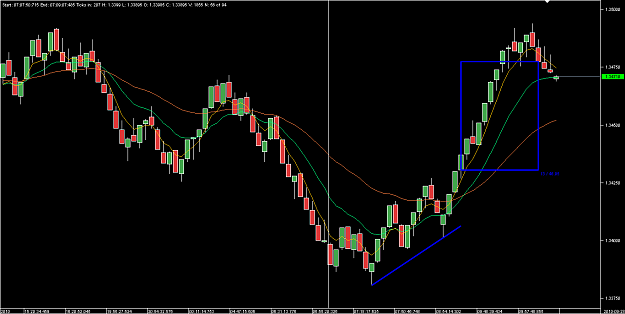
I post these examples mainly to highlight all the good HL/LH setups that are there everyday off good areas. Also the more I write about the setups and post examples and trades the more times I go over it in my head which is good for my trading.
Cheers
Reflex.
Attached Image (click to enlarge)