• Home
  • Forums
  • Trades
  • News
  • Calendar
  • Market
  • Brokers
  • Login
  • Join
  • User/Email: Password:
  • 7:50pm
Menu
  • Forums
  • Trades
  • News
  • Calendar
  • Market
  • Brokers
  • Login
  • Join
  • 7:50pm
Sister Sites
  • Metals Mine
  • Energy EXCH
  • Crypto Craft

Options

Bookmark Thread

First Page First Unread Last Page Last Post

Print Thread

Similar Threads

Looking for compression breakout indicator 16 replies

Time Compression Trading: Exploiting Multiple Time Frames in Zero Sum Markets 9 replies

Project Omega: What is this ? 6 replies

My project over the year/years.... 21 replies

  • Trading Discussion
  • /
  • Reply to Thread
  • Subscribe
  • 22
Attachments: Compression Project
Exit Attachments
Tags: Compression Project
Cancel

Compression Project

  • Last Post
  •  
  • Page 1 2
  • Page 1 2
  •  
  • Poll

  • When looking for trade setups, what data can you ignore?
  •  
  •  
  •  
  •  
  •  
  •  
  •  
  • Post #1
  • Quote
  • First Post: Edited Oct 1, 2010 4:41am Sep 26, 2010 4:23am | Edited Oct 1, 2010 4:41am
  •  robdee
  • Joined Jul 2006 | Status: Mighty Mooloo Country | 480 Posts
Compression Project (brief description)


  1. Investigate compression as a hidden dimension of market behaviour.
  2. Price is visible at all times, compression is not visible.
  3. It is found using (Compression = Volume / Price Range).

Is compression increasing or decreasing ?

What effect does compression have on price ?

Anyone here familiar with Ohm's Law that describes electrical circuits ?

Current(amps) = Voltage(volts) / Resistance(ohms)

What happens to current if the voltage is going up and down ?

I was studying Ohms law when I was about 11 years old for my ham radio licence and experimenting with all kinds of circuits in my workshop with power supplies, meters, varistors and all that stuff, so I have a crystal clear intuitive 'feel' for electrical circuits. (zzaaappp Yoww!)


  1. Can the metaphor of Ohms law be applied to markets?
  2. What are the relationships between time, volume, order flow, price movement, and resistance to price movement ?
  3. What comes first volume changes, price changes, or something else ?
  4. How much 'pressure' or 'voltage' is required to move the price in a new direction and how long does it take to apply that pressure ?


Fact: Lots of orders not moving price must be encountering opposition.
Is this (like) a high voltage and high resistance circuit with low current?

Fact: Lots of orders moving price a lot must not be encountering opposition.
Is this (like) a high voltage and low resistance circuit with high current?

References:
Compression as an Idea to Describe Market Activity
Trading Chaos by Bill Williams
Structure of Forex by Darkstar

Indicators:
Compression.mq4 latest version in Post #15
  • Post #2
  • Quote
  • Edited 6:47am Sep 26, 2010 6:15am | Edited 6:47am
  •  Alihuzaifa
  • | Membership Revoked | Joined Oct 2008 | 2,791 Posts
gosh I dont think too much physics is required for trading
 
 
  • Post #3
  • Quote
  • Sep 26, 2010 3:23pm Sep 26, 2010 3:23pm
  •  Rednose
  • Joined Mar 2009 | Status: Member | 1,330 Posts
Very interesting Rob, keep your thoughts flowing on that I´ll be reading and maybe I can contribute to your thread, if you allow.
Thank you for sharing.

Red.
 
 
  • Post #4
  • Quote
  • Sep 27, 2010 8:53am Sep 27, 2010 8:53am
  •  supremeChaos
  • Joined Feb 2009 | Status: Borderline yahoo & oh-no! | 6,607 Posts
robdee,
nice to have ham-radio inspired thread.
Keep it up Sir!
 
 
  • Post #5
  • Quote
  • Sep 27, 2010 9:16am Sep 27, 2010 9:16am
  •  Naseri13
  • Joined May 2010 | Status: I'M NOT SIGNAL PROVIDER | 1,169 Posts
Glad too see you here , I will follow you and your theird , Go on
A little beginner trader since 2006
 
 
  • Post #6
  • Quote
  • Edited Sep 28, 2010 3:37am Sep 27, 2010 1:43pm | Edited Sep 28, 2010 3:37am
  •  robdee
  • Joined Jul 2006 | Status: Mighty Mooloo Country | 480 Posts

What is it exactly that makes price move ?


Limit orders do not move price, they just sit there waiting to be filled. Limit orders provide liquidity at a specific price only, they do not search out and consume liquidity at other prices. Doing that is the role of market orders.


Market orders arrive and immediately consume liquidity at the best price available. If all the opposing orders at that price are filled then a gap is left open. Subsequent market orders move into the gap in search of more liquidity to consume. This is what moves the price.

What about stop orders?

Buy stops, sell stops, ordinary 'take me out' stops - do they move price ?

Indeed they do, these are real movers. As soon as a stop order is hit (any kind of stop order) it is converted into a market order.

This makes sense. If price is moving against a position and I have an agreement with my broker to take me out at a certain level, I don't want a partial fill, I want to get completely out, and get out now. The only kind of order that can be filled completely now is an order that searches out liquidity and consumes it at the best price available. That of course is a market order, and only a market order.

Think about it, are there any brokers who guarantee stop order prices without charging a premium to do so ? If they do guarantee stop prices at no extra cost, how can they do that ?

Are stop orders involved in slippage? Yes they must be, by definition. Remember, market orders move and follow price. All stop orders are filled as market orders, so they are going to be filled at variable prices unless there happens to be more than enough liquidity to go around for all the stops that need to be filled at a price. Priority execution comes into this too. I mean who gets first shot at the available liquidity.

This is what I see with my broker. Limit orders always fill at the price I specify or better. If I do get some negative slippage it is always on my 'instant' market orders and pending stop order fills.

What happens when an important level is broken and a cluster of stop orders are hit ? They all convert to market orders and immediately consume whatever liquidity is available, this can move price quickly. Moving price quickly near key levels will likely trigger more stops and a cascading effect accelerates the process.

Huge commercial trades need huge liquidity to fill their orders. Where can they find that much counter-party liquidity ? One place to look is in these stop cluster cascades.

Do you notice how price often will spike briefly through a previous high/low then reverses strongly in the opposite direction - what was going on ? Note, we often see long candle wicks running out into new price territory in these situations.


  1. Where are the stops likely to be located in those situations ?
  2. Who provides the liquidity to match all those stop/market orders when they cascade out ?

I recommend a detailed explanation of the mechanics of price movement found in nubcake's eye-opening rant on the subject.

Now, how does mechanics of price movement relate to compression ?

I'll be focusing on this question myself over the next couple of days, lets see what we can come up with. - robdee


  • Post #7
  • Quote
  • Edited 6:07am Sep 28, 2010 5:41am | Edited 6:07am
  •  robdee
  • Joined Jul 2006 | Status: Mighty Mooloo Country | 480 Posts
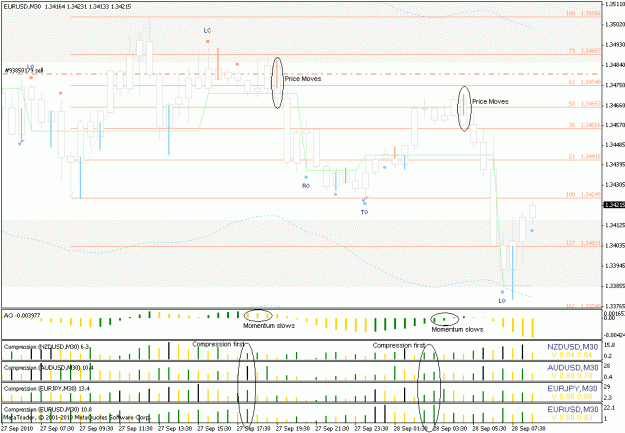
Time now for a practical look at what compression readings can do for us...

If we can look inside the candles and see how much pressure is building up this should give us a kind of early warning radar system.

We know to move price there must be orders coming in. To slow down an existing move and turn it around takes time and takes lots of orders. These orders get compressed into small candles near the end of a move.

For example...

Let's assume we are in a downtrend and there is a good retrace back up against the trend.

When is that retrace finished, when are the bulls ready to collapse and let us have another run down ?

  1. Weakness in an up move is shown as candles get smaller and upper wicks appear showing selling pressure. The battle between the bears and the bulls is heating up.
  2. This intense activity shows up first in compression readings.
  3. Momentum continues slowing down even after the heavy compression is over.
  4. About one hour after the big compression event across all four currencies is over the bulls crank it up one last time only to get shot down by the bears.

Here is my chart to illustrate... (click image for a larger version)

Attached Image (click to enlarge)
Click to Enlarge

Name: compression-eurusd-m30-20100928.gif
Size: 26 KB
 
 
  • Post #8
  • Quote
  • Sep 28, 2010 9:41am Sep 28, 2010 9:41am
  •  Mindsphere
  • | Joined Jul 2009 | Status: Member | 412 Posts
Interesting theory you're developing here robdee.

Seeing as my current trading has taken me in a similar direction I just thought I'd give you my two cents.

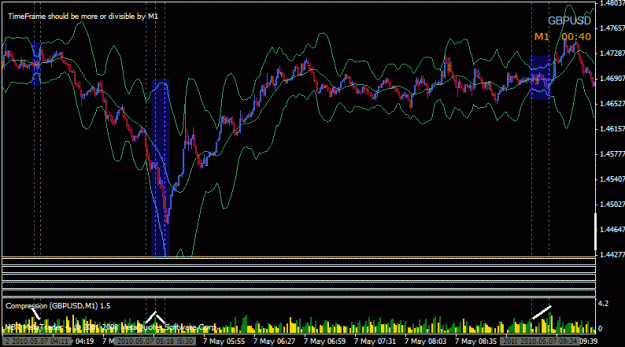
Firstly, I know this is a hotly debated topic, but volume in forex (which is actually just tick volume) is not a good indicator of true volume. Interesting post on this topic here: http://tremblinghandtrader.typepad.c...ue-volume.html

With that in mind, my suggestion to you would be to drop the indicators and look at what price is actually doing in relation to your theory. I believe it's quite possible to gauge momentum of price by looking at the relative sizes of candles. I'd also suggest that this works better on lower time-frames as institutional traders are actually far more involved in the "live" market than many on FF would have you believe. Have a look at today's GBPUSD movements on M1. Some very nice examples, to be sure.

Either way, best of luck
 
 
  • Post #9
  • Quote
  • Edited 8:35pm Sep 28, 2010 6:57pm | Edited 8:35pm
  •  robdee
  • Joined Jul 2006 | Status: Mighty Mooloo Country | 480 Posts
Quoting Mindsphere
Disliked
...this is a hotly debated topic, but volume in forex (which is actually just tick volume) is not a good indicator of true volume.
Ignored
Mindsphere, thanks for raising this question. I also understood and believed that tic volume in retail forex is simply rubbish.

The reason is most data feeds originate from a broker rather than from a true interbank market. This is especially true with brokers who offer fixed spreads and/or pricing in full pip increments. The true interbankmarket does not have fixed spreads and pricing is in 1/10th pip (decimal) increments.

To offer fixed spreads a broker must be summarising the interbank data and feeding through to clients just their in-house price changes. In that case we have no idea what their tic volumes actually represent. The output of some kind of summation algorithm I'd say - in other words rubbish.

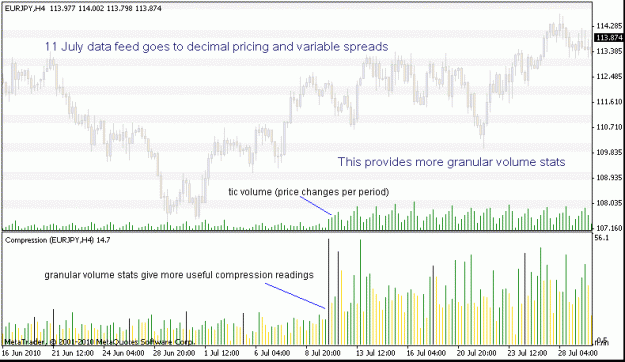
Now, what if the broker is connected to interbank pricing data and passes through all the price changes, both bid and ask, to the clients ? Not only that but the price fluctuations are now in 1/10th pip increments. This then provides a much more granular view of activity in the market place. While it still cannot represent the actual number of contracts it still is a good relative measure of activity levels.

Reading Bill Williams and the VSA threads here on FF I started to view forex tic volume more seriously. I also looked back to earlier in the year when my broker switched to decimal pricing and variable spreads. The number of tics per period jumped up dramatically, they were feeding me a lot more data every hour than before. It was more data and it was more representative of what was going on out in the wider market. Excellent!

See what happened here on 11 July ...

Attached Image (click to enlarge)
Click to Enlarge

Name: compression-eurjpy-h4-20100711.gif
Size: 18 KB


So, how good is the data feed from your broker ?

Are they trying their best to give you a true representation of the interbank market (including tic volume) or are they summarising it down to make it simpler, less granular, and less useful ?
 
 
  • Post #10
  • Quote
  • Sep 29, 2010 12:24am Sep 29, 2010 12:24am
  •  lascavel
  • | Joined Oct 2008 | Status: Member | 122 Posts
Nice thread rob, always refreshing to have a new perspective in analysis. I have some experience in using such techniques & i will be more then glad to jump in if my schedule allow...

Cheers!
 
 
  • Post #11
  • Quote
  • Edited 6:53am Sep 30, 2010 4:16am | Edited 6:53am
  •  robdee
  • Joined Jul 2006 | Status: Mighty Mooloo Country | 480 Posts
As I investigate compression as a hidden dimension of market activity I keep noticing a repeated sequence of what I call dance moves.

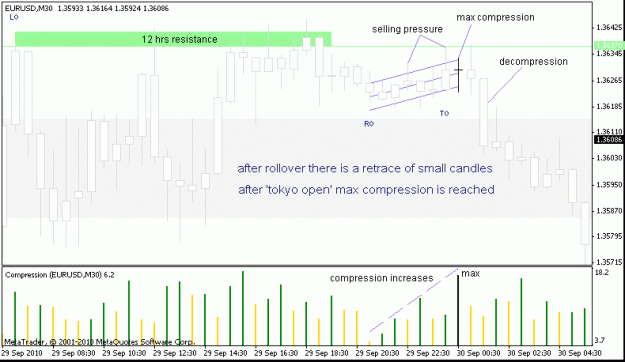
Basic Rollover Dance Moves


  1. price cannot break resistance for 12 hours
  2. price drops down
  3. after rollover price retraces up towards resistance again
  4. during this retrace compression increases
  5. all the retrace candles are small in a narrow channel
  6. max compression is reached with doji or similar
  7. price drops down again on low compression

Attached Image (click to enlarge)
Click to Enlarge

Name: compression-eurusd-m30-20100930.gif
Size: 16 KB


What does it mean ?

After rollover trading activity builds up steadily leading into Tokyo Open.
Activity is increasing but the price only moves slowly because it is meeting opposition.
The strength of this opposition is measured by compression.

When perfect balance is achieved and momentum has slowed to zero (seen on doji like candles) compression reaches a peak. Effortlessly now the bears take over and price accelerates down.

Can I learn to dance in sync with these moves, and not push against them ?

http://l.yimg.com/hu/shots/36981-shot.gif
 
 
  • Post #12
  • Quote
  • Sep 30, 2010 8:25am Sep 30, 2010 8:25am
  •  eurotrash
  • Joined Sep 2009 | 392 Posts
Quoting robdee
Disliked
I also looked back to earlier in the year when my broker switched to decimal pricing and variable spreads. The number of tics per period jumped up dramatically, they were feeding me a lot more data every hour than before.
Ignored
As far as I'm aware, EBS pricing has less tick volume than ECNs or retail brokers. More tick volume could sometimes be more noise. Although, of course it is better to have pricing in fractional pips.

http://img829.imageshack.us/img829/2357/usdjpy.jpg


(Screen from soultrader)
 
 
  • Post #13
  • Quote
  • Sep 30, 2010 8:23pm Sep 30, 2010 8:23pm
  •  robdee
  • Joined Jul 2006 | Status: Mighty Mooloo Country | 480 Posts

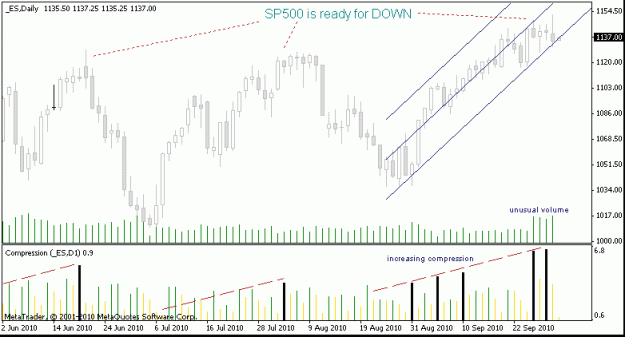
  1. Huge volume this week on SP500 futures (ES).
  2. Activity levels are extraordinary four days in a row.
  3. Increasing compression during past month rally.
  4. Max compression (2 std deviations) hit twice this week.
  5. Previous max compression events (18 June and 3 Aug).

Attached Image (click to enlarge)
Click to Enlarge

Name: compression-es-d1-20101001.gif
Size: 14 KB


This means I'm now looking for Risk-OFF trades. Watching for the sell-down of riskier asset classes globally and repatriation of USD to drive up the dollar and drive down the currencies I favour AUD NZD EUR.
 
1
  • Post #14
  • Quote
  • Oct 1, 2010 4:11am Oct 1, 2010 4:11am
  •  robdee
  • Joined Jul 2006 | Status: Mighty Mooloo Country | 480 Posts
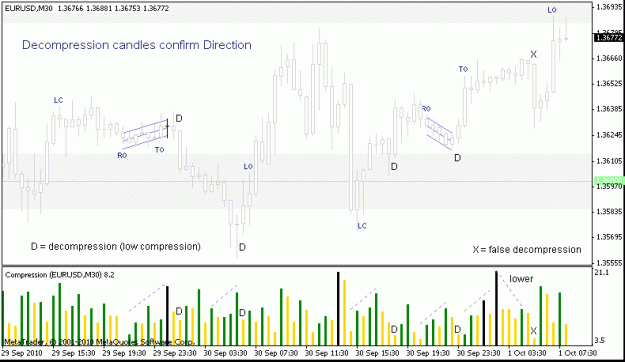
What direction is price likely to move ?


  1. First I look for a cycle of increasing compression lasting two hours or more.
  2. The Compression indicator green bars or black bars should be making higher highs during the compression cycle.
  3. After a compression cycle the yellow bars then show decompression (lower compression).
  4. What I'm looking for is the smallest yellow bar before any new green bar comes along.
  5. The smallest yellow bar must match a confident price move (not just another candle stuck in a range).

When these criteria are met I call this a true Decompression Candle.

True decompresion candles are labelled D on the chart below...

Attached Image (click to enlarge)
Click to Enlarge

Name: compression-eurusd-m30-20101001.gif
Size: 16 KB


Decompression candles confirm the direction of the forces that caused the compression cycle to build up like that.
 
1
  • Post #15
  • Quote
  • Oct 1, 2010 4:35am Oct 1, 2010 4:35am
  •  robdee
  • Joined Jul 2006 | Status: Mighty Mooloo Country | 480 Posts
OK, had some people asking about the indicator I'm using.
All my indicators are free for personal non-commercial use.
All I ask is that my copyright is respected.


I try to make each indicator do one simple job well, I don't do multi-purpose indicators.

I'll keep track of all suggestions for improvements to future versions.
Private messages are the best way to send feedback to me about the indicator.

Here is the code... (see file attached at end of post for download)

Inserted Code
//+-----------------------------------------------------------+
//| INDICATOR for volume compression          Compression.mq4 |
//| copy to [experts\indicators] and recompile or restart MT4 |
//+-----------------------------------------------------------+
//| Free software for personal non-commercial use only.       |
//| No guarantees are expressed or implied.                   |
//| Feedback welcome via Forex Factory private message.       |
//+-----------------------------------------------------------+
#property copyright "Copyright © 2010 Robert Dee"
#property link      "www.forexfactory.com/member.php?u=12983"

/**
   ==== NOTES ABOUT 'COMPRESSION' AS AN IDEA TO DESCRIBE MARKET ACTIVITY ====

   compression is measured in tics per point (tics of volume / range of candle)
   in other words how many tics of volume are 'compressed' into the candle
   basically high compression means a lots of activity but not much price movement

   for example: a candle with volume = 1632 tics, range = 136 points (13.6 pips) 
                therefore compression = (1632 tics / 136 points) = 12 tics/point

   small candles with exceptionally high compression are interesting and useful
   exceptional compression highlights trading activity 'hiding' in smaller candles
   when the pressure blows out the price will move away on larger 'low compression' candles
**/

#define INDICATOR_VERSION    20101001
#define INDICATOR_NAME       "Compression"
#define RELEASE_LEVEL        "Public"
#define MT4_BUILD            226

#property indicator_separate_window
#property indicator_buffers 3

#property indicator_color1 Green     // Compression histogram colour
#property indicator_color2 Gold      // LessCompression histogram colour
#property indicator_color3 Black     // MaxCompression histogram colour
#property indicator_width1 2
#property indicator_width2 2
#property indicator_width3 2

extern string CurrencySymbol = "";    // "" means use the chart symbol (eg EURUSD)
extern int    TimeFrame      = 0;     // 1 5 15 30 60 240 1440 10080 43200 (0 means use the chart timeframe)
extern string SymbolLabel    = "_symbollabel"; // name of textlabel for currency symbol (user creates a textlabel with this name)

// persistent variables
double Compression[];
double LessCompression[];
double MaxCompression[];
double VolumeArray[];    // not a display buffer
double lastcompression;
string period;

//+------------------------------------------------------------------+
//| init() sets up the display buffers once when indicator is loaded
//+------------------------------------------------------------------+
int init()
{
// TimeFrame validation
   if(TimeFrame == 0) TimeFrame = Period();
   if(TimeFrame > 0) // if a timeframe value has been input
      {
      if(TimeFrame < 5) TimeFrame = 1;
      if(TimeFrame > 5 && TimeFrame < 15) TimeFrame = 5;
      if(TimeFrame > 15 && TimeFrame < 30) TimeFrame = 15;
      if(TimeFrame > 30 && TimeFrame < 60) TimeFrame = 30;
      if(TimeFrame > 60 && TimeFrame < 240) TimeFrame = 60;
      if(TimeFrame > 240 && TimeFrame < 1440) TimeFrame = 240;
      if(TimeFrame > 1440 && TimeFrame < 10080) TimeFrame = 1440;
      if(TimeFrame > 10080 && TimeFrame < 43200) TimeFrame = 10080;
      if(TimeFrame > 43200) TimeFrame = 43200;   
      }
   switch(TimeFrame){case 1: period = "M1"; break; case 5: period = "M5"; break; case 15: period = "M15"; break; case 30: period = "M30"; break; case 60: period = "H1"; break; case 240: period = "H4"; break; case 1440: period = "D1"; break; case 10080: period = "W1"; break; case 43200: period = "MN1"; break; default: period = "Unknown"; break;}
// find currency symbol
   if(CurrencySymbol == "") CurrencySymbol = Symbol();
// Compression style
   SetIndexStyle(0,DRAW_HISTOGRAM);
// LessCompression style
   SetIndexStyle(1,DRAW_HISTOGRAM);
// MaxCompression style
   SetIndexStyle(2,DRAW_HISTOGRAM);
// setup indicator buffers
   SetIndexEmptyValue(0,0);
   SetIndexEmptyValue(1,0);
   SetIndexEmptyValue(2,0);
   SetIndexBuffer(0,Compression);
   SetIndexBuffer(1,LessCompression);
   SetIndexBuffer(2,MaxCompression);
// names for DataWindow and indicator subwindow label
   IndicatorDigits(1);
   IndicatorShortName(INDICATOR_NAME+" ("+CurrencySymbol+","+period+")");
   SetIndexLabel(0,"Compression");
   SetIndexLabel(1,"");
   SetIndexLabel(2,"MaxCompression");
// message to the experts log (shows in reverse order)
   Print("Copyright © 2010 Robert Dee, All Rights Reserved");   
   Print("Free software for personal non-commercial use only. No guarantees are expressed or implied.");
   Print(INDICATOR_NAME+" indicator version V"+INDICATOR_VERSION+" for "+RELEASE_LEVEL+" release, compiled with MetaTrader4 Build "+MT4_BUILD);
// VolumeArray setup
   ArraySetAsSeries(VolumeArray,True); // not a display buffer
return(0);
}

//+------------------------------------------------------------------+
//| start() function is called once every time price changes (tic)
//+------------------------------------------------------------------+
int start()
{
int      shift, bars = iBars(CurrencySymbol,TimeFrame);
double   multi = MathPow(10,MarketInfo(CurrencySymbol,MODE_DIGITS));
double   range, compression, uband;
ArrayResize(VolumeArray, bars);

shift = bars-1;
while(shift >= 0)
   {
   // force redraw of candles
   Compression[shift] = 0;
   LessCompression[shift] = 0;
   MaxCompression[shift] = 0;
   range = iHigh(CurrencySymbol,TimeFrame,shift) - iLow(CurrencySymbol,TimeFrame,shift); // find the range of this candle (High - Low)
   if(range == 0) range = MarketInfo(CurrencySymbol,MODE_POINT);                         // prevent divide by zero errors, make the range at least one point
   compression = iVolume(CurrencySymbol,TimeFrame,shift) / range / multi;                // find the compression (Volume / Range)
   if(compression > lastcompression) {Compression[shift] = compression; LessCompression[shift] = 0;}
   if(compression < lastcompression) {Compression[shift] = compression; LessCompression[shift] = compression; }
   lastcompression = compression;                                                        // remember this compression to compare next time
   VolumeArray[shift] = iVolume(CurrencySymbol,TimeFrame,shift);                         // load volumes into a hidden buffer for later analysis
   shift--; // move forward one candle
   }

///////////////////
// MAX COMPRESSION
// MaxCompression is compression greater or equal to 2 standard deviations above SMA16
// this uses MT4 built-in Bollinger Bands on the Compression array to calculate the deviations
shift = bars-1;
while(shift >= 0)
   {
   uband = iBandsOnArray(Compression,0,16,2,0,MODE_UPPER,shift);
   if(Compression[shift] >= uband-0.1) MaxCompression[shift] = Compression[shift];
   shift--; // move forward one candle
   }

///////////////////////
// UPDATE SYMBOL LABEL
if(ObjectFind(SymbolLabel) >= 0) ObjectSetText(SymbolLabel, CurrencySymbol+","+period);

} // end of start()

//+------------------------------------------------------------------+
//| deinit() does the cleanup once when the indicator is shutdown
//+------------------------------------------------------------------+
void deinit()
{
int i = 0, bars = iBars(CurrencySymbol,TimeFrame);
while(i < bars)  // cleanup all the buffers
   {
   Compression[i] = 0;
   LessCompression[i] = 0;
   MaxCompression[i] = 0;
   VolumeArray[i] = 0;
   i++;
   }
}
Compression indicator V20101001 (1 Oct 2010) is attached below.
Save it in MT4\experts\indicators folder and restart MT4 to compile it.
Attached File(s)
File Type: mq4 Compression.mq4   7 KB | 1,177 downloads
 
1
  • Post #16
  • Quote
  • Oct 1, 2010 5:09am Oct 1, 2010 5:09am
  •  robdee
  • Joined Jul 2006 | Status: Mighty Mooloo Country | 480 Posts
I approve Compression.mq4 integration into any non-commercial EA or non-commercial indicators.

The sample interface code below fits into the start() function of your EA.

Inserted Code
// compression means (volume / candle range)
// compression values in buffer 0 (there are no zero values)
    
double compression = iCustom(Symbol(),Period(),"Compression",0,shift);

// less compression means it is less than previous value
// less compression values in buffer 1 (there are zero values)
    
double lesscompression = iCustom(Symbol(),Period(),"Compression",1,shift);

// max compression means a value 2 std deviations above sma16
// maxcompression values in buffer 2 (there are zero values)
    
double maxcompression = iCustom(Symbol(),Period(),"Compression",2,shift);
Of course it may make more sense to simply calculate compression in your own code.
 
 
  • Post #17
  • Quote
  • Oct 1, 2010 6:03am Oct 1, 2010 6:03am
  •  ha-pattern
  • Joined Sep 2008 | Status: hardcore chartist | 2,173 Posts
Nice idea.

Your method reads like a confirmation of Bollinger Bands (15,4):
Attached Image (click to enlarge)
Click to Enlarge

Name: 09312010 compression, decompression.gif
Size: 22 KB
 
 
  • Post #18
  • Quote
  • Edited 5:45pm Oct 4, 2010 5:35pm | Edited 5:45pm
  •  robdee
  • Joined Jul 2006 | Status: Mighty Mooloo Country | 480 Posts
Quoting robdee
Disliked
This means I'm now looking for Risk-OFF trades. Watching for the sell-down of riskier asset classes globally and repatriation of USD to drive up the dollar...
Ignored
“The risk-off trade is helping the dollar a little bit,” said Carl Forcheski, a director on the corporate currency sales desk at Societe Generale SA in New York. “The euro has gone one way for all of September, so things got overextended.”

Dollar Advances as Economic Concern Saps Demand for Higher-Yielding Assets
 
 
  • Post #19
  • Quote
  • Oct 7, 2010 4:25pm Oct 7, 2010 4:25pm
  •  robdee
  • Joined Jul 2006 | Status: Mighty Mooloo Country | 480 Posts
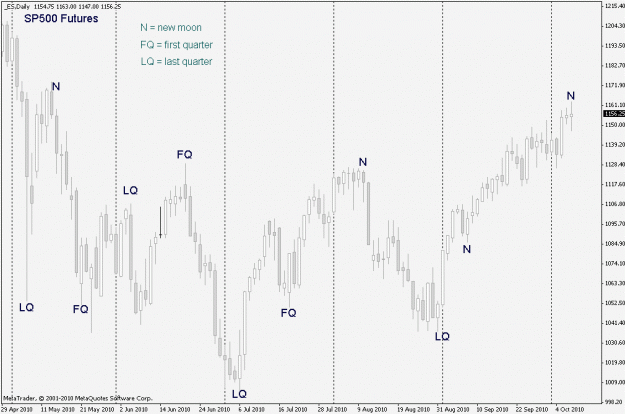
When all else fails... consult the stars...

Attached Image (click to enlarge)
Click to Enlarge

Name: lunarphases-es-d1-20101007.gif
Size: 22 KB


“There is a tide in the affairs of men, Which taken at the flood, leads on to fortune. Omitted, all the voyage of their life is bound in shallows and in miseries. On such a full sea are we now afloat. And we must take the current when it serves, or lose our ventures.” - William Shakespeare
 
 
  • Post #20
  • Quote
  • Oct 20, 2010 3:15pm Oct 20, 2010 3:15pm
  •  robdee
  • Joined Jul 2006 | Status: Mighty Mooloo Country | 480 Posts
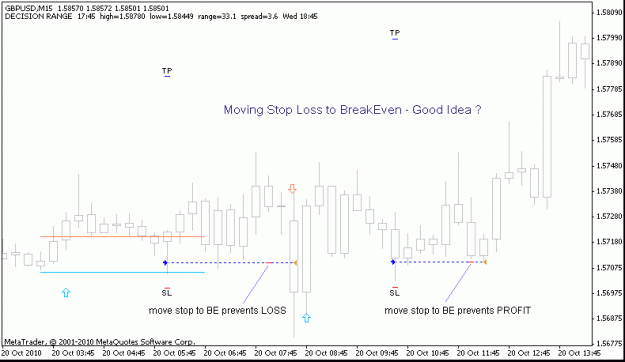
GBPUSD trading last night gave me reason to question this practice.


  1. Is moving the StopLoss to breakeven a good trading decision or not ?
  2. Does this practice improve profitability ?
  3. If this is not a useful practice, then why do I do it ?

Attached Image (click to enlarge)
Click to Enlarge

Name: movestopbe-gbpusd-m15-20101020.gif
Size: 11 KB
 
 
  • Trading Discussion
  • /
  • Compression Project
  • Reply to Thread
    • Page 1 2
    • Page 1 2
0 traders viewing now
  • More
Top of Page
  • Facebook
  • Twitter
About FF
  • Mission
  • Products
  • User Guide
  • Media Kit
  • Blog
  • Contact
FF Products
  • Forums
  • Trades
  • Calendar
  • News
  • Market
  • Brokers
  • Trade Explorer
FF Website
  • Homepage
  • Search
  • Members
  • Report a Bug
Follow FF
  • Facebook
  • Twitter

FF Sister Sites:

  • Metals Mine
  • Energy EXCH
  • Crypto Craft

Forex Factory® is a brand of Fair Economy, Inc.

Terms of Service / ©2023