DislikedWOW.....This is the purest form of looking at the market. How do you use the above data?. Can you kindly elaborate on the same.
Thanks for the insight.Ignored
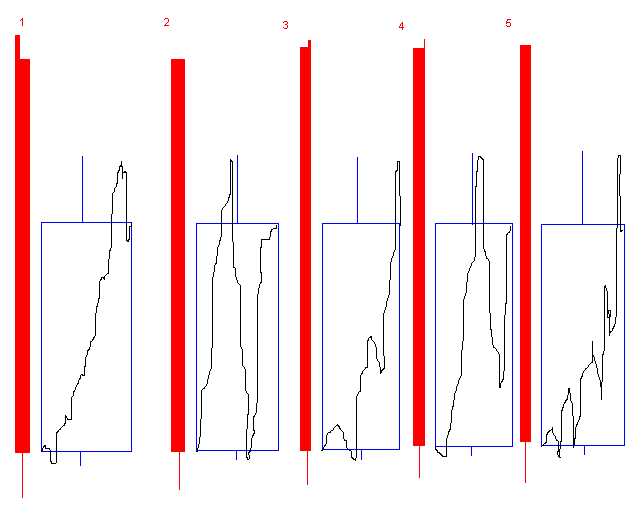
For me, patterns is generated in a random manner. But the chart is useful by all means, because it gives the observation of the two forces.
Think about how the chart would show up, when the market is very limit heavy on one side, while light on the other. It gives you a basis, either the market is at a "BID" market, or a "ASK" market.
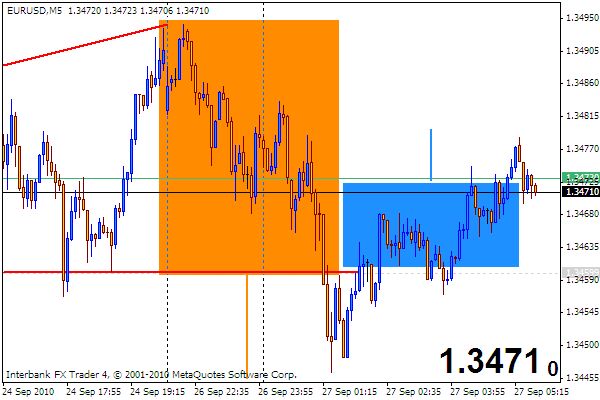
When the market is in a "BID" mode, and price is going down, you would expect prices to move in a slower, softer manner (THINK ABOUT THE VELOCITY, ACCELERATION OF THE MOVE). That, is called a retracement. In a reverse, the market changes from a "BID" mode to a "ASK" mode. The retracment would hit FAST and HARD. It shows a LACK OF LIMITS.
An example: Fib traders often get caught in these REVERSES as RETRACMENTS, going against the trend at the wrong time. But relying on the MAGIC NUMBERS instead of what price is showing them, they often take in most of the selling in a dumping situation. The numbers took their attention away from what the market place is telling them.
Hope it helps
Life is a school for the soul