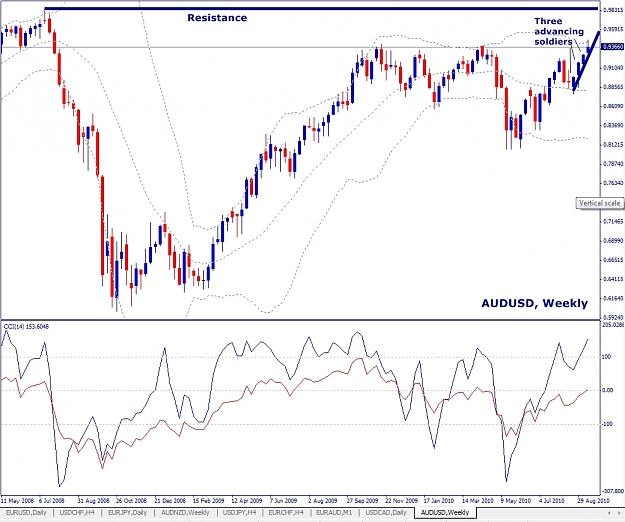
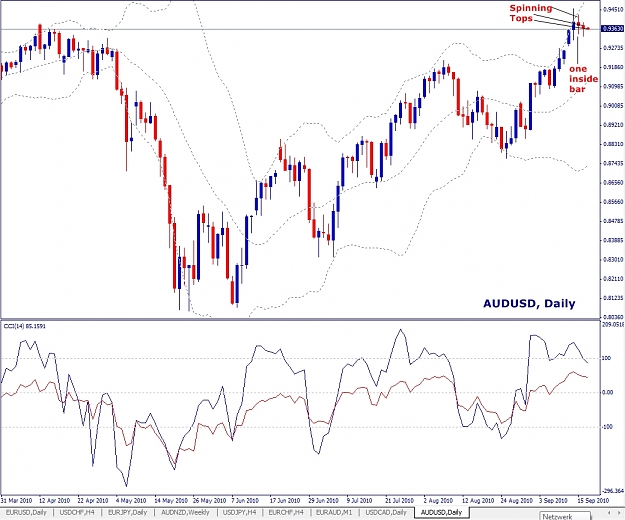
AUDUSD on D1 TF .. Candle Pattern state possible The Bearish Three Inside Down Pattern and check to WK TF possible shooting star.....
D1 TF CCI 14 is on the negative div......
tomorrow I hope we will see Bearish engulfing pattern to confirm the reversal of AUD .. key point area 0.923xx for middle term reversal and 0.91xx
and long term down trend is below 0.87xxx
The Bearish Three Inside Down Pattern is another name...
Ignored
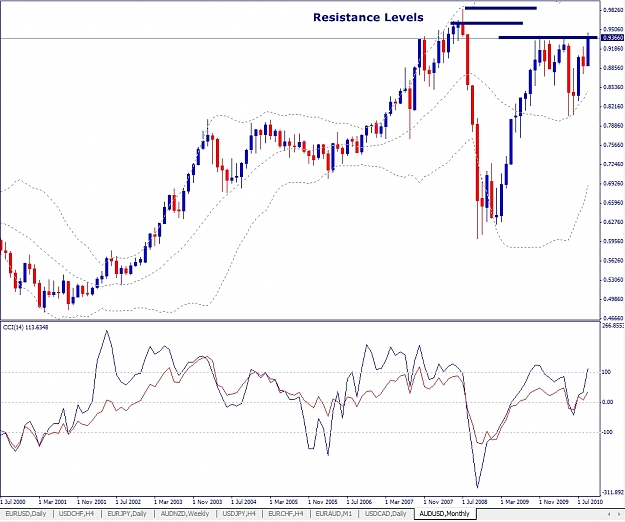
Weekly and monthly chart shows an upward trend and monthly is now struggling at his resistance level around 0.9385 like 2009.11.01 and 2010.04.01. If the price vola are related powerful like 2010.07.01 and 2010.05.01 we could see prices over 0.962. In addition the Bearish Harami Pattern isn't a real classical one.
Bearish Harami
If the first candle of Harami is a long bullish candle then the pattern has bearish implications. Especially if the pattern appears on top of an uptrend then it could be a sign of reversal (see image).
If the second candle is a doji or a bearish spinning top then the reversal sign could be more reliable but there are times that even a bullish spinning top could be a good sign of reversal. Since this pattern is not a reliable one at all times, the best practice is to use other tools to confirm it.
May be in conjunction with BB we have a powerful argument more, so Bollinger Band might to be a good tool for this purpose. In this special market environment now, someone could tend to prefere to use the Enhanced Bands Indicator which could be even better as combines both BB and volatility to predict the tops (and the bottom) of the market.
Moreover: My daily chart shows only one inside pattern and not three of them. It could also be only some spinning tops which make an appearance at the weekly and monthly resistance level.
So I stay at the sideline due to the fact that the weekly and monthly chart are in a powerful upward trend and due to the fact that friday is a day where a trader shoudn't regularily trade. So we'll see next week, may be end of month more. My mind is: Be careful! I would trade M30/H1/H4 but not the turnaround at the daily chart now!, although good powerful arguments are here for a trading daily down.
Weekly and monthly chart shows an upward trend and monthly is now struggling at his resistance level around 0.9385 like 2009.11.01 and 2010.04.01. If the price vola are related powerful like 2010.07.01 and 2010.05.01 we could see prices over 0.962. In addition the Bearish Harami Pattern isn't a real classical one.
Bearish Harami
If the first candle of Harami is a long bullish candle then the...
I like your interpetation very much and I think this is that big capital will mislead most of the 95% traders now. It could be that the market price will go down. We don't know. But I think now many traders take a short and tomorrow friday big capital could turn market price up in the heaven. Earliest opportunity! Why not? This could going to happen willy-nilly. If so then we could see a scenario like this: most of the traders will exit there loss trade if not a stop loss have they turn out of the market before and then when market price should pushes enough high, the big turn down will coming soon! So I go with one's gut. But we have no securities. Could be that market price will turn down and never come up again this month. I don't know. For me probabilities seems not so ideal, so for me I stay at the sideline and wait. Time will come and I earn my money - sure enough,...but not at a friday!
The word Harami in Japanese means pregnant. A Harami candle formation is a two candlestick pattern. In an ideal form the first candle has a long real body and the second candle is a spinning top. The real body of the second candle is located within the body of the first candle. In other words open and close of the second candle are within the open and close of the first candle. The Harami pattern is similar to the "inside day" Western pattern. If the second candle is a doji then Harami is called Harami Cross or Petrifying Pattern (see image).
The second candle (i.e. the smaller one) could be a doji, a bearish candle, or a bullish candle both in bearish and bullish situations.
Bullish Harami
If the first candle of Harami is a long bearish candle then the pattern has bullish implications. Especially if the pattern appears at the bottom of a downtrend then it could be a sign of reversal (see image).
If the second candle is a doji or a bullish spinning top then the reversal sign could be more reliable but there are times that even a bearish spinning top could be a good sign of reversal. Since this pattern is not a reliable one at all times, the best practice is to use other tools to confirm it. I have personally found Bollinger Bands (BB) to be a good tool for this purpose. You may also use the Enhanced Bands indicator which could be even better as combines both BB and volatility to predict the bottoms and tops of the market.
Bearish Harami
If the first candle of Harami is a long bullish candle then the pattern has bearish implications. Especially if the pattern appears on top of an uptrend then it could be a sign of reversal (see image).
If the second candle is a doji or a bearish spinning top then the reversal sign could be more reliable but there are times that even a bullish spinning top could be a good sign of reversal. Since this pattern is not a reliable one at all times, the best practice is to use other tools to confirm it. I have personally found Bollinger Bands (BB) to be a good tool for this purpose. You may also use the Enhanced Bands indicator which could be even better as combines both BB and volatility to predict the bottoms and tops of the market.
Harami patterns could appear both as continuation and reversal signs.
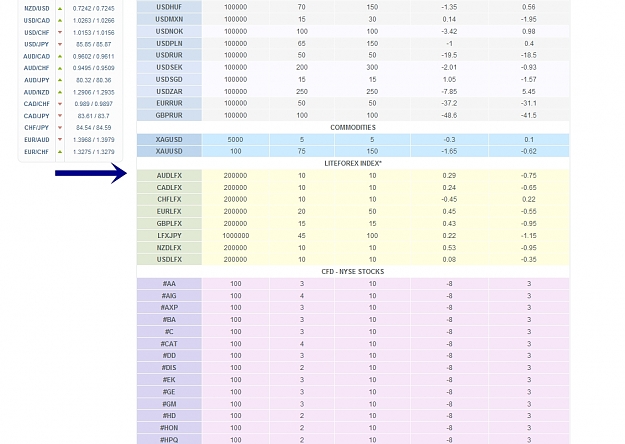
Thank you FXCube. I also had the opportunity to get some feedback from MrHb30Jr about it. My confusion was created because of my broker which is forex.com does not provide me those indexes in their MT4. So, I didn't know how interpret them. Anyway, Thank you both of guys.
Just out of curiosity. Any of you guys have a comment about Gold. It is dancing with the highest. I know this guy "gold" is bipolar and schizophrenic. Thank you in advance for your opinions.
Just out of curiosity. Any of you guys have a comment about Gold. It is dancing with the highest. I know this guy "gold" is bipolar and schizophrenic. Thank you in advance for your opinions.
Ignored
Hi CostaRica
Oil prices seems for me assessable. Gold seems for me absolutely an unratable commodity. I have some shorts but I'm not content with it however much it will run in the win one day.
Silver is at its top at 20.90 an I think that we'll see the 9/10 again in the next months. In longer term (some years) big investment could hype silver up till 100$ or 200$ or even much more. It's out of our hands now!
...which pairs and timeframes do you prefer forexcube?
Ignored
Hi PhAnTi'
Look at the Market Tips and the history file #694, please or here, #48 please. There are all these currencies which I have trade in the last weeks, in demo as well as at the real accounts.
(Or at the history files in the attachment at this forum).
I prefere the H4 timeframes with an eye toward Daily at present, the daily with regard at Weekly and Monthly and when I scalping often alongside the M5 with a view to M15/M30/H1.
why don't wrtie any EA for this great system?! : p
Ignored
Hello PhAnTi'
Oh yes it could be really interesting!
I have only a little knowledge about mq4 code just now, may be I will take more time and learn more about it next year. Isn't complicated, may be complex.
Hope that someone is interesting to write an EA and post it here.
May be with CCI(14) tops and bottoms, say the 100/200 line and the upper and lower Bollinger Band at H4 for the first.
Is someone here who is interesting in writing an EA?
Normal risk Deposit: 100'000.-$
Beginning Date: 2010 August 27
Target:............................Status quo:
0.25% per day (250.-$),.... current 1%
1% per week (1'000.-$),.... current 5%
5% per month (5'000.-$),... current 15%
50% per year (50'000.-$). (4 days a week = 1%, let's say 5% per month, and 10 months a year, so 50% per year).
updated:
2010 September 17
Equity: +115'316.39$; Profit: +15'316.39$
Notice:
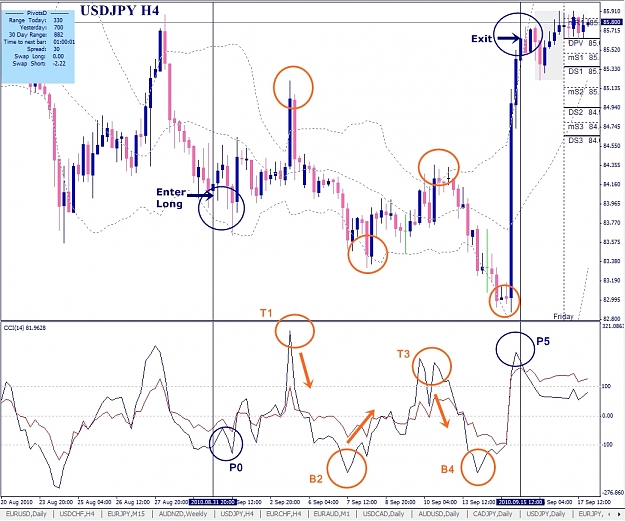
Trading the CCI(14) Tops and Bottoms with a comfortable advanced trading style?
Why wait till the lower Top CCI T2 and not go out at its highest T1?
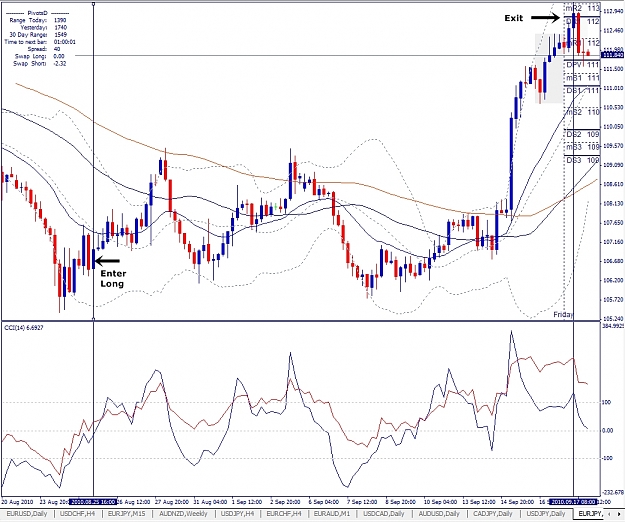
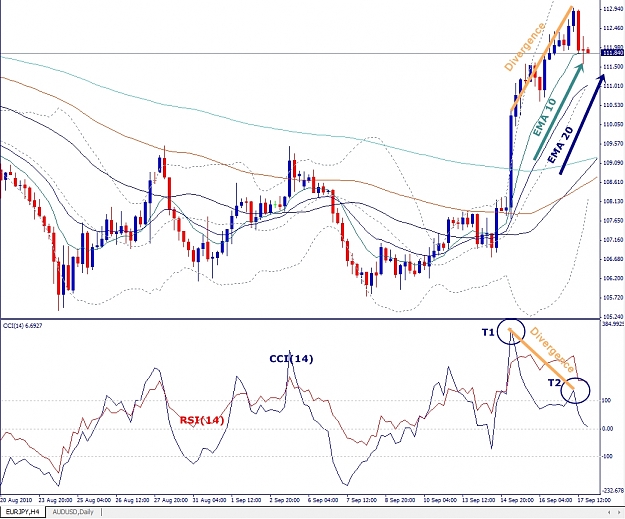
T1 shows a CCI(14) Top and you could go easy out at this point: 109.97 (Pivot D S2) or 110.15 (murrey math mml7 "Sell Premium Zone"). Why not? If so you have earn your money, simple too,..., may be not the most of possible money! Why? The EMA 10/20 lines was in a strong uptrend (high volatility) and so let the win run and take more risk over and wait a little more, may be with setting a stop loss e.g. at mS2 110.52 after T1 you could have run the win further on. There was a price action down (see the two red candles between DS1 and DPV) but they hadn't triggered the stop loss. The next CCI Top T2 shows then definitely a significant divergence at H4 chart and so it would be better to take out the profit here by not later then.
EURJPY, H4, 2010 September 17, v1
EURJPY, H4, 2010 September 17, v2
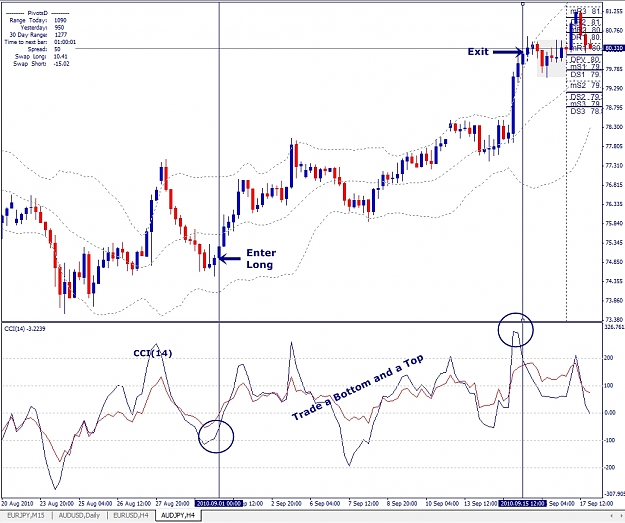
You could trade theTops and the Bottoms at CCI(14)
Preferred Trades: P0 (Long), T1 (Exit & Short), B2 (Exit & Long), T3 (Exit & Short), B4 (Exit & Long), P5 (Exit) and go out of the market , because it's friday.
If you start sweating when you watch the price swings of a product you have invested in, you either have the wrong trading concept, are in the wrong products, or your positions are too big.
The biggest losses happen after investors make their first big profits. If you accumulate profits with a proven, tested investment strategy, you can pride yourself on its success.
However, if you make profits without an investment strategy, you may lose not only all your profits but your total investment. Unexpected price moves do not have to mean big losses; they occur because investors work with the wrong trading concept.