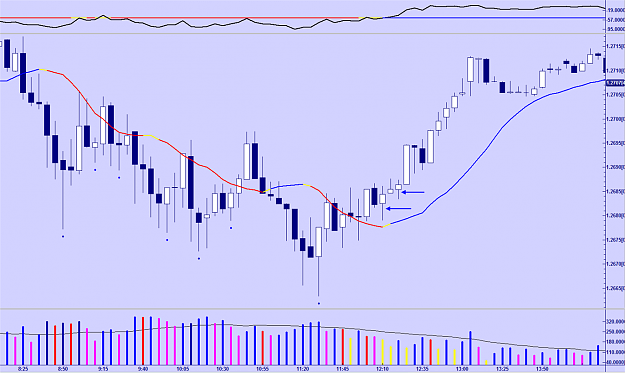
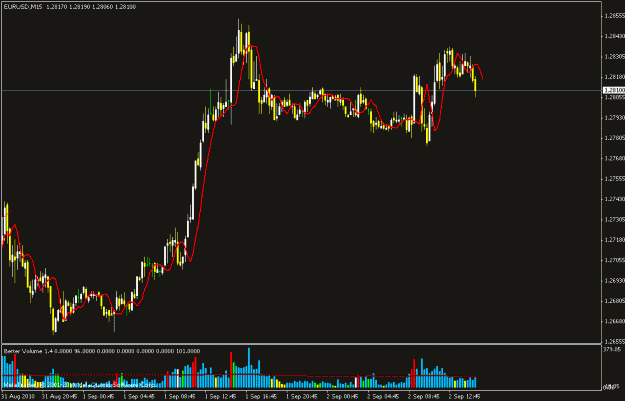
Looking at today, it was pretty clear. Just look at the thicker red line and the marked down candle. Support held perfectly. Plus, the down candle closed in the middle, clearly showing there was still buying interest (demand). That would be enough for me to go long.
Yes, there are times when stuff isn't clear, with many contrarian signals. My suggestion would be to take a break and then look at higher TFs before digging deeper. Look at any resistance/support areas and see how price is reacting to them.
Also, news like NFP or today's ECB conference (looking forward to hearing all the silly questions during that) and speeches can easily shake you out of the market. Of course, it may very well be what you are looking for as a trader.
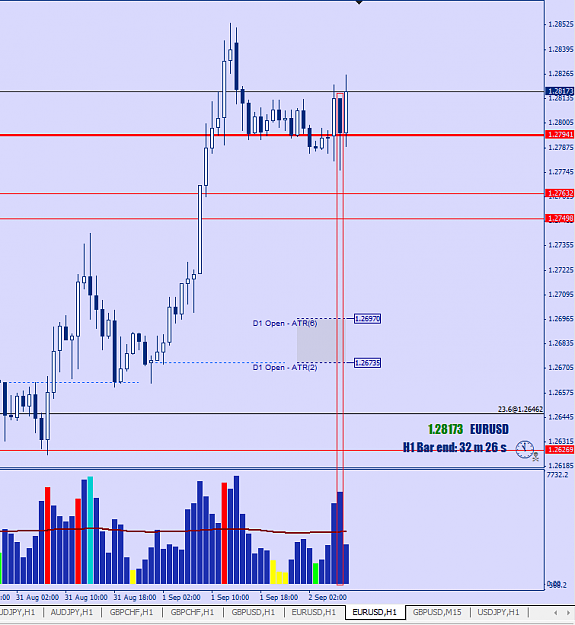
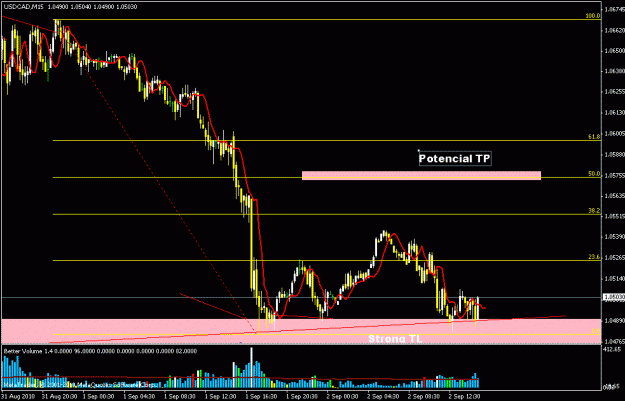
For me, I like 1 hour charts and I look at resistance/support areas, draw channels and look for either no demands, climactic action or anything that would tell me which way the price is likely to go. I use lower TFs for any signs of reversals to exit. Oh and I never look at 4 hour volume. It's usually worthless. I may very rarely look at it for candle formations if other TFs don't help.
Yes, there are times when stuff isn't clear, with many contrarian signals. My suggestion would be to take a break and then look at higher TFs before digging deeper. Look at any resistance/support areas and see how price is reacting to them.
Also, news like NFP or today's ECB conference (looking forward to hearing all the silly questions during that) and speeches can easily shake you out of the market. Of course, it may very well be what you are looking for as a trader.
For me, I like 1 hour charts and I look at resistance/support areas, draw channels and look for either no demands, climactic action or anything that would tell me which way the price is likely to go. I use lower TFs for any signs of reversals to exit. Oh and I never look at 4 hour volume. It's usually worthless. I may very rarely look at it for candle formations if other TFs don't help.
Attached Image (click to enlarge)