Alpari keep closing down my new demo accounts (which was opened yesterday at 2'500.- $ deposits and in the win with 4'800.-$),..., and it had the same thing keep happening to me until I filled in real information in the demo registration screen, including a real email. Solid ever since.
New Demo Broker
I have changed now at FXDD:
Beginning Date: 2010 August 25 - (HR 1)
Deposit: 20'000.-$ This account will be guide with extremely high risk. So drawdowns could be made over 50% to Total Loss.
Target is 4:1, say 3 accounts could be running in a win between 100-300% and the fourth one will suffer a total loss.
It's really completely different as you make more conservative MM statements.
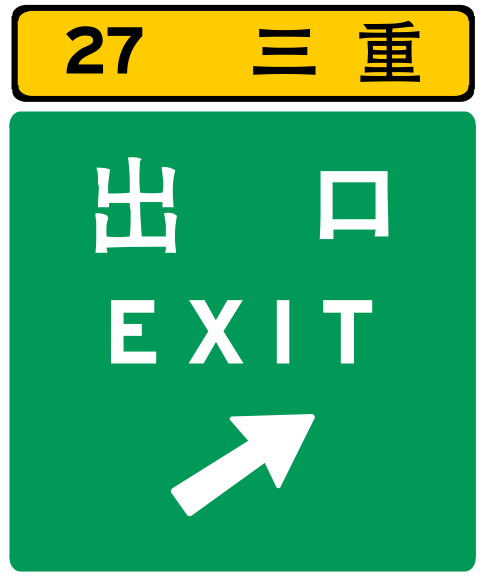
Look at all the open positions, the pending orders and the History File
A DIBs-type system might suit you (inside bar breakouts). This way an account can't get killed when a range becomes a trend, AND vice versa.
Maybe somewhat like Larry Connor's NR7 bars (find the narrowest range bar in last 7, and trade the breakout of the NR bar), ie. volatility contraction and expansion.
Your various systems all seem to be based on picking tops and bottoms (with MTF CCI, Bollinger bands, pivots, Murrey Math, etc., as filters). Maybe try doing the opposite: find a narrow range (a NR bar or inside bar), and trade the range break.
The key point is no tops and bottoms. That seems to be the achilles heel here. My 2 cents only.
ForexCube,
A DIBs-type system might suit you (inside bar breakouts). This way an account can't get killed when a range becomes a trend, AND vice versa.
Maybe somewhat like Larry Connor's NR7 bars (find the narrowest range bar in last 7, and trade the breakout of the NR bar), ie. volatility contraction and expansion.
Your various systems all seem to be based on picking tops and bottoms (with MTF CCI, Bollinger bands, pivots, Murrey Math, etc., as filters). Maybe try doing the opposite: find a narrow range...
Ignored
Hi bit9ret
Your ideas are excellent and will give the TCT strategy a special effect. Will work it out in the next days. If you have some charts yet upload some/many of these here, please.
I've gotta go, but here are inside bars marked. GU is noisy but this is quite clear here....Breakout/close out of the inside bars.
Go with the expansion of volatility = the close out the range = inside bar. (It's just a coincidence that they are top and bottoms here or are reverting inwards).
Just stay away from mathematical** indis like CCI, BB etc. (OB/OS, even MTF OB/OS, becomes even more OB/OS = mega trend = account blow up when one fades it) and go for "indis" that mark price bars.
**Mathematical indis process a series of prices and assume serial/self correlation, whereas PA is discontinuous, ie. anything can happen.
Things that are rare tend to be the most valuable. This is the way that breakout traders should approach the currency market. I like to look at breakout trading from a volatility perspective because the central idea behind breakouts is that periods of low volatility are followed by periods of high volatility. Sounds complicated? It isn't. What is the Definition of a Breakout?
According to the American Heritage Dictionary, a breakout is defined as a forceful emergence from a restrictive condition. How Does it Apply to Trading?
In trading, a breakout is a situation where a currency is caught within a tight range that has a clearly defined support and resistance level. When the support or resistance point is broken, a breakout occurs because the currency pair forcefully emerges from its restrictive price range.
The following chart of the EUR/USD is a simple example of a breakout. In October 2007, the EUR/USD was trapped within a 200 point trading range for at least a week with a clearly defined support and resistance level. When the resistance level was broken, the EUR/USD emerged from its range bound environment and proceeded to rally 400 pips with virtually little retracement. http://images.tradingmarkets.com/200...p020508-11.gif
Source: eSignal
Unfortunately finding breakouts on the charts is easy, but trying to time a breakout is hard. This is where the Inside Day Strategy that I teach in my book Day Trading the Currency and advisory service BKTraderFX comes into play. This strategy is actually very popular in the world of professional trading, but new traders are frequently amazed by its ease and reliability. Currencies are extremely trending which increases the accuracy of Inside Days. Like pink diamonds, Inside Days are extremely rare, but when they manifest themselves, the signal is very powerful. In order to spot inside days, nothing more is needed than basic candlestick charts. What are Inside Days?
An inside day is defined as a day where the daily trading range of a currency pair is contained within the prior day's trading range. In other words, the day's high and low do not exceed the previous day's high and low as indicated by the following candlesticks: http://images.tradingmarkets.com/200...p020508-12.gif
Inside days represent decreasing volatility because each day's range is smaller than the next.
With the inside day trading strategy, we need to see at least two inside days because seeing just one is simply not significant enough. The more inside days the better because it increases the likelihood that the breakout will have follow through. The inside day trading strategy is best applied on daily charts because the longer the time frame, the more significant the breakout. The following candles illustrate what two inside days look like (the candles can be red or green): http://images.tradingmarkets.com/200...p020508-13.gif Rules for the Inside Day Trading Strategy
Here are the rules or general guidelines that I like to use for trading Inside Days:
Long:
1. Identify a currency pair where the daily range has been contained within the prior day's range for at least two days (we are looking for multiple inside days).
2. Buy above the high of the most recent inside day.
3. Place stop and reverse order at least 10 pips below the low of the nearest inside day.
4. If the position moves higher by the amount that you risked sell half of the position and replace the stop and reverse with a trailing stop.
Protect Against False Breakouts: If the stop and reverse order is triggered, place a stop at least 10 pips below the low of the nearest inside day and protect any profits larger than what you risked with a trailing stop.
The rules are the reverse for a short trade if the breakout occurs to the downside. Deconstructing the Trading Rules
No one likes to follow rules without understanding them and I am big believer of understanding the premise behind each rule in my strategies so that traders realize which ones are flexible and which ones aren't.
Rule # 1 is the core of the strategy. We MUST see at least two inside days in order for the setup to be valid. If there is only one inside day, the strategy should not be considered.
Rule # 2 is the action that puts us into the position. We want to buy at the first sign that the range is expanding or that the volatility is increasing. Therefore we buy as soon as the price breaks above the high of the closest inside day candle. More conservative traders who want to make sure that the breakout is real can buy when the price breaks above the inside day candle one day before the most recent one, but buying then will also increase the amount of pips at risk.
Rule # 3 has two purposes. The first is to act your stop, the second is to prevent against false breakouts. Every trade needs a stop and our stop on a long trade is placed 10 pips below the low of the most recent inside day because I believe in technical stops over monetary stops. The idea is that if we are in a long trade and the currency breaks below the low of the most recent inside day, then the prior breakout is false and no longer valid. However, given the significance of an inside day breakout, we actually add an order to short when the long position is closed so that we can capitalize on a breakout to the downside.
Rule #4 is the most flexible. Here, we exit half of the position for nothing other than a monetary reason. Then we move our stop to breakeven on the second lot and trail our stop so that we can capture as much of the breakout moves as possible. Aggressive traders may choose to trail by a 1 bar low while conservative ones choose to trail by a 3 or 5 bar low or a technical indicator.
Now let us take a look at an example:
In the same EUR/USD chart shown above, we actually see our two inside days in the area highlighted. According to our trading rules, we go long the EUR/USD when it breaks the high of the most recent inside day at 1.4280. Our initial stop and reverse order is placed at the low of the closest inside day minus 10 pips or 1.4179. This means that we are risking 101 pips. Therefore our initial target is the amount risked or 1.4381, which was triggered the very next day. Then we moved our stop on the remaining half of the position to breakeven. We trail the stop by a 2 bar low, meaning that we only exit the position when the price of the currency pair has broken below the low of the past two days. This happens 12 days after we put on the initial trade and we end up closing the second half of our position at 1.4554 for a profit of 101 pips on the first lot and 274 pips on the second. http://images.tradingmarkets.com/200...p020508-14.gif
Source: eSignal Key Points to Remember
The Inside Day trading strategy works best on Daily charts and currency pairs that are very trending such as the EURUSD, USDJPY, and GBPUSD. For further optimization, technical formations can be used in conjunction to the visual identification to place a higher weight on a specific direction of the breakout. For example, if the inside days are building and contracting towards the top of a recent range such as a bullish ascending triangle formation, the breakout has a higher likelihood of occurring to the upside. The opposite scenario is also true, if inside days are building and contracting towards the bottom of a recent range and we begin to see a bearish descending triangle is in formation, the breakout has a higher likelihood of occurring to the downside. Kathy Lien is the Chief Strategist of DailyFX.com, the world's leading source for Forex News and Research. You can also follow her strategies and trade ideas on her blog, kathylien.com. She is an internationally published author of Day Trading the Currency Market and Millionaire Traders: How Everyday People Beat Wall Street at its Own Game, published by Wiley.
Posted on April 14th, 2009 Inside Bar Forex Trading Entry
This article will discuss the Inside bar trading strategy , a trading method I have used successfully for most of my trading career. My trading involves all methods pertaining to price action, they are not used in conjunction with indicators or other systems. I use a plain vanilla price charts tp look for the inside bar and other patterns as they form naturally on 240 minute and daily price charts. What is an inside bar ?
An inside bar is a bar or series of bars which is/are completely within the range of the preceding bar, or , i.e. it has a higher low and lower high than the bar immediately before it (some traders use a more lenient definition of inside bars to include equal bars). On a smaller time frame it will look like a triangle. What Does it mean? An inside bar indicates a time of indecision or consolidation. Inside bars often occur at tops and bottoms, in continuation flags, and at key decision points like major support/resistance levels and consolidation breakouts. They often provide a low-risk place to enter a trade or a logical exit point. When to use the signal
The most logical time to use an inside bar is when a strong trend is in progress or the market has clearly been moving in one direction and then decides to pause for a short time. If we play the break out, our stop loss can be defined by placing it below the half way point of the outside bar or mother candle, or for the more conservative trader, below the outside bar itself. This would mean that the market muse break a 3 bar low to take us out of the trade.
These inside bars are very good when trading a trend on the 240 minute charts and the daily charts. Special Notes
More advanced traders may also identify market turning points when trading against the trend, but this wil take plenty of screen time to learn, so its not suggested for novice traders.
The Inside bar forex strategie is a flashing light, a major signal to the trader that reversal or continuation is about to occur.
See the example below for a classic inside bar break out, and a classic inside bar stall pattern.
Article by Nial Fuller - copyright www.learntotradethemarket.com See below example http://learntotradethemarket.com/wp-...bar-images.gif
My Price Action Setups: Pin Bars, Fakey’s, Inside Bars
Posted on January 17th, 2010
My 3 core Price Action Setups: Pin Bar, Fakey, Inside Bar
Pin Bar Setup:
The pin bar is a staple of the way I trade the forex market. It has a very high accuracy rate in trending markets and especially when occurring at a confluent level. Pin bars occurring at important support and resistance levels are generally very accurate setups. Pin bars can be taken counter trend as well, as long as they are very well defined and protrude significantly from the surrounding price bars; indicating a strong rejection has occurred. In the following chart example we will take a look at pin bars occurring with the context of a trending market, my favorite way to trade them. Notice how each pin bar resulted in movement that met or exceeded the next logical resistance point, marked on the chart as “target”
Pin bars occurring within the context of a trending market on the GBP/JPY daily chart: http://learntotradethemarket.com/wp-...ads/gbpjpy.gif Fakey Setup:
The fakey setup is another bread and butter price action setup. It indicates rejection of an important level within the market. The forex market is designed to fake traders out, as often times the market will appear to be headed one direction and then reverse, sucking all the amateurs in as the professionals push price back in the opposite direction. The fakey setup can set off some pretty big moves in the forex market. The chart we will look at below shows a fakey that occurred in the EUR/USD market that set off a huge down ward movement.
Nice fakey setup that occurred at a major turning point on EUR/USD daily: http://learntotradethemarket.com/wp-...ds/eurusd3.gif
Inside Bar Setup:
The inside bar is a great trend – continuation signal. It shows a brief consolidation and then a break out in the dominant trend direction. Inside bars are best played on daily and weekly charts. They allow for very small risks and yet very large rewards. The inside bar combined with a very strongly trending market is one of my favorite price action setups. We can see in the chart below an inside bar that formed on daily USD/JPY after a strong pin bar signal changed trend direction. This inside bar occurred at a 50% retrace level as well as a support level, whenever we get price action at a confluent level like this it is viewed as a very strong setup.
Inside bar setup on daily USD/JPY: http://learntotradethemarket.com/wp-...s/usdjpy11.gif
...
Copywrite – Learn To Trade The Market Author Nial Fuller
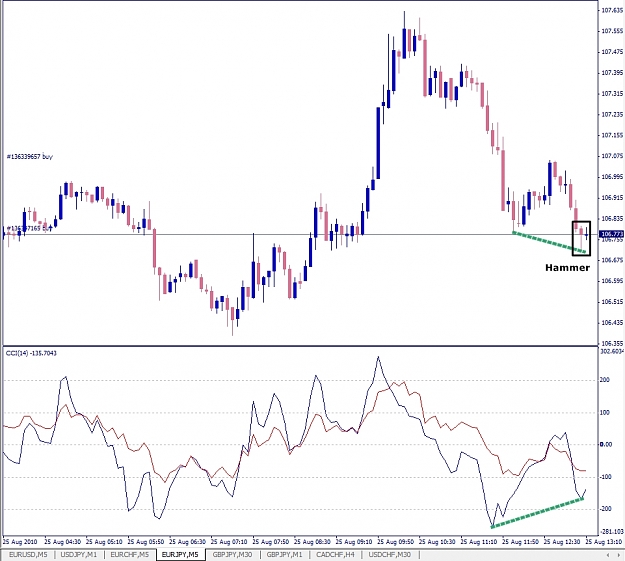
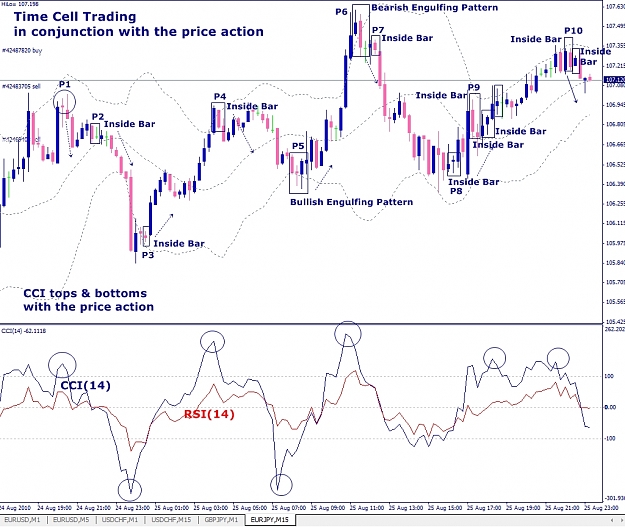
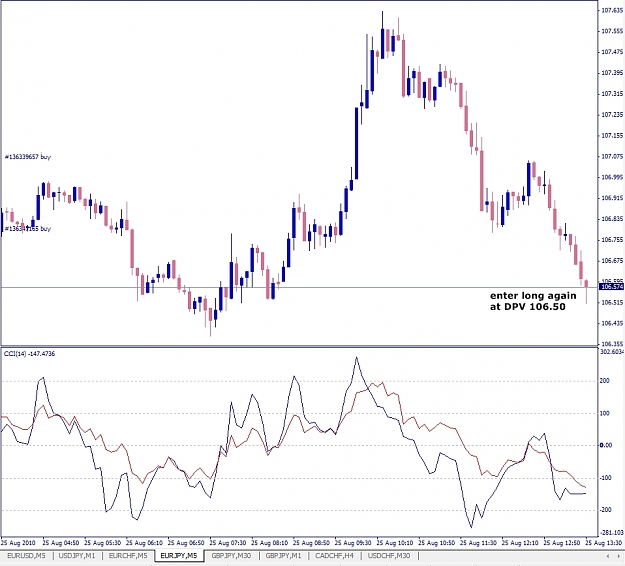
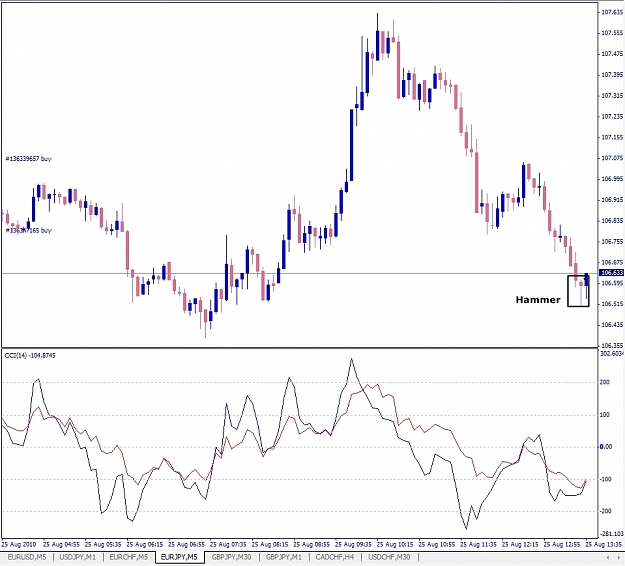
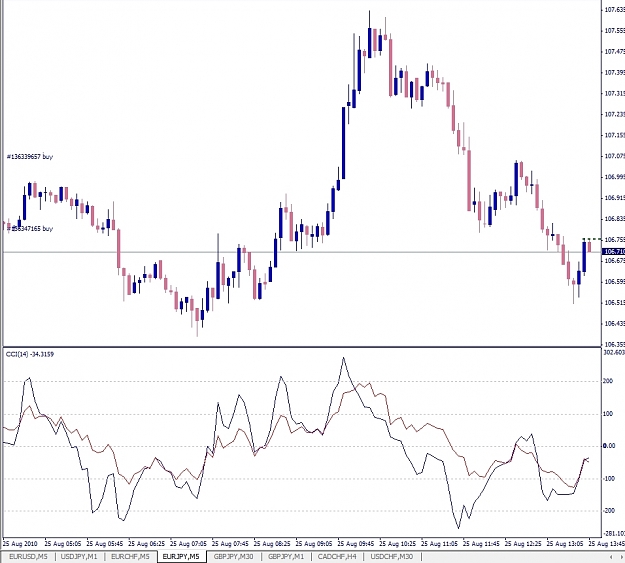
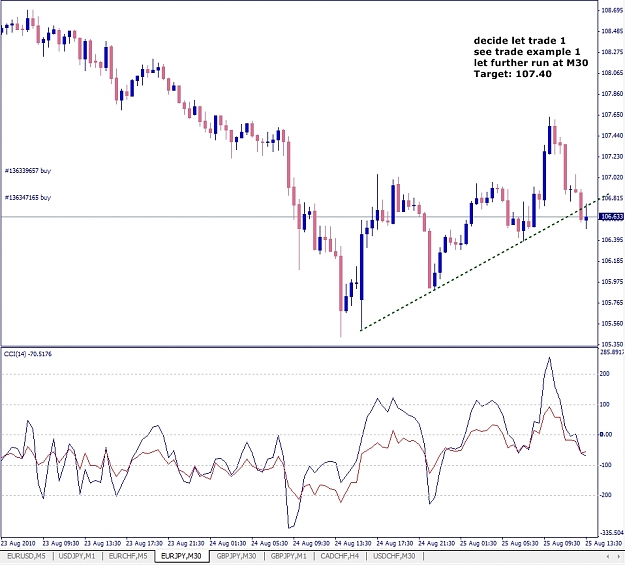
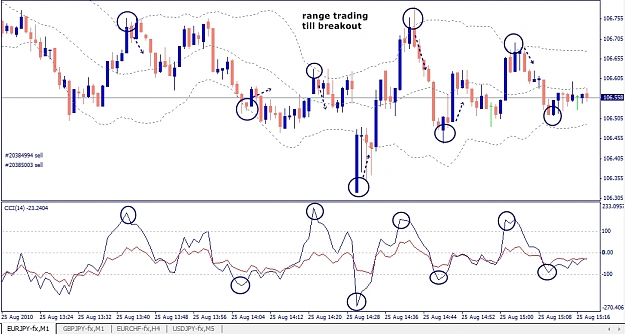
P9: Normally when trading only with CCI(14) it's a Short. The following inside bars couldn't give the confirmation, so I would it let short and go with the second inside bar long (hedging position) till P10. P10 is Exit and Short and I have to wait with one open position Short at P9 if the price will falling under the P9 line.