hello fellow traders!
i made a discovery today and wanted to share with everyone. it's nothing amazing but it definitely helps me understand a little more.
many systems will advocate trading with the trend by verifying on a higher time frame. for example, if you're trading on 15M you should only go short if the higher 1H frame is trending down.
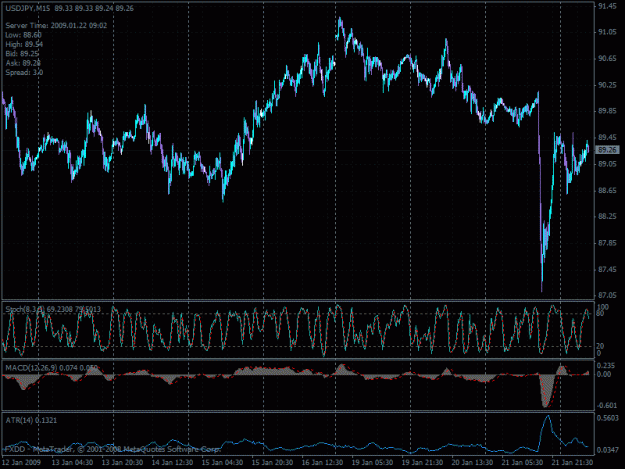
anyways, i was messing around with the charts in an attempt to just have 1 single time frame tell me information from a higher time frame. i tried increasing all the parameters of the indicators by the increase in time and everything worked to my amazement!
hmmm...that didn't sound like it made sense, so i attached screenshots. they are 15M and 4H charts. for each 4H period = 16 * 15M periods. so i multipled every parameter by 16, and the indicators are pretty much 1:1. it's pretty neat! check it out...


