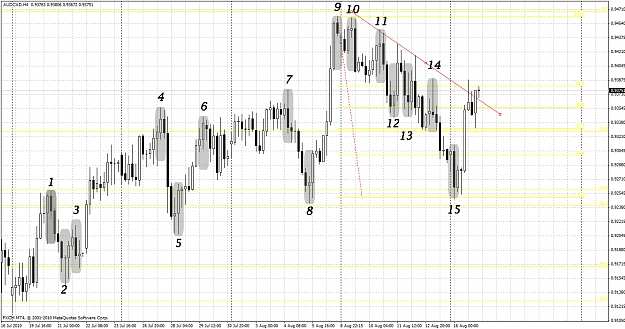
Hello Petar. I hope you don't mind. I kind of invited myself. I was thinking I understand the leading is higher than previous and next candle on a sell. Got it. Opposite on buy. My main area of confusion is "ENTRY". So, here is my chance to pester you. I grabbed a 4h chart here AUDCAD. I highlighted some potential setups. I did not take the time to screen them for strict 50% rule which I am a little confused anyway. That wasn't the point of the operation. The was I marked each one and that way you could tell one or two or ANY that are good setups and where the heck I would enter these trades. I appreciate the feedback as always. Great job by the way. You are a great trader.
Hello Petar. I hope you don't mind. I kind of invited myself. I was thinking I understand the leading is higher than previous and next candle on a sell. Got it. Opposite on buy. My main area of confusion is "ENTRY". So, here is my chance to pester you. I grabbed a 4h chart here AUDCAD. I highlighted some potential setups. I did not take the time to screen them for strict 50% rule which I am a little confused anyway. That wasn't the point of the operation. The was I marked each one and that way you could tell one or two or ANY that are good...
Ignored
Hmm you didnt undestand well,
Your 3,4,5,6,7,8,9,10,11 are bad becouse Leading candle cant be larger than candle 1 and candle 2...
I took Buy on NZDUSD we have good formation and i wont waiting candle to finish becouse i know this will be good setup we have high from todays candle and that high is higher from leading candle that is all i need,this can be invalid setup just in case that today price go down 120 pips wich is low posibility...
I will go for 100 pips also i added Fibs and looks very promising
We mis this train,this was before 3 days but looks very good >
AUDUSD H4
Ignored
It doesn't look like it met rule #2.
EDIT: I see now. I thought the leading candle had to close beyond the midpoint. You show several examples where it doesn't. It only has to protrude beyond it.
EDIT: I see now. I thought the leading candle had to close beyond the midpoint. You show several examples where it doesn't. It only has to protrude beyond it.