Hello all,
after so many trial failed and error , finally i have found the way that works for me , and i understand how the forex market works
i'd like to pay back to this community what i have learned
forex market is open 24hrs so time is not important
price is important
people always said buy dip and sell high but without the proper
technique ,,,, how to get in and what signal ????
All indicators are failed , not exactly if you know how to used it properly
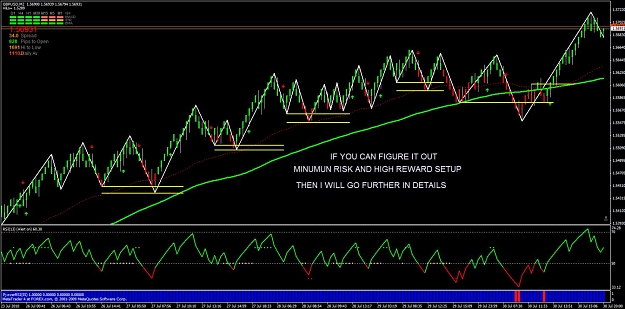
i have attached a chart if anyone can see it useful then i will continue with details if not then i stop
Market Structure = Key
Failed Setup is the trade that pays most money
as you all know the law of trend
Uptrend = a series of HH & HL ,,, 1 HH do not make a trend
vice versa of Downtrend , 1 LL do not make a trend
You Don't Need to Pick TOP & BOTTOM
Structure Point and Price is the Key
NOTHING WORKS BETTER THAN CHART STRUCTURE
THAT'S HOW THE PROS DO
THE CHART IS BUILT ON STRUCTURE JUST LIKE THE BUILDING
SO THE PRICE LEVEL IS STRUCTURE
THE DIFFERENCE OF PRICE AGREEMENT THAT MOVES THE MARKET
ALL OTHER FACTORS IS NOT MATTER
OUR JOBS IS TO MAKE MONEY
TO TAKE ADVANTAGE OF THESE FAILURE AND SUCCESS OF THESE BEHAVIORS
WHERE MARKET REACTED AROUND THESE POINTS
THESE POINTS TELLS US WHERE MARKET IS GOING
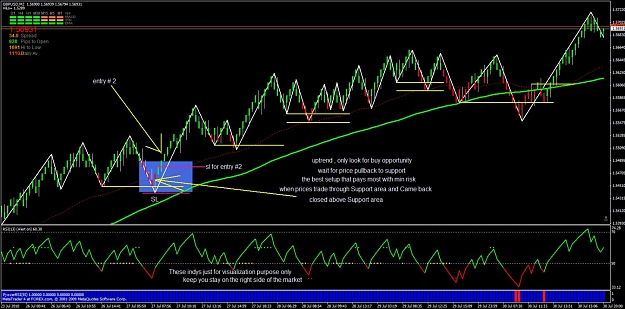
THE RSI IS JUST FOR VISUALIZATION PURPOSE TO KEEP US STAY ON THE RIGHT SIDE
OF THE MARKET ,
THE KEY IS THE PRICE LEVEL OR SWING HIGH OR SWING LOW
OR S/R OR WHATEVER YOU WANT TO CALL IT
THESE LEVELS ARE VERY IMPORTANT
THIS METHOD WORKS BEST AT EACH SESSION OPEN
WHEN PRICES BREAK THESE LEVELS INDICATED
SOME VOLUME BUYING AND SELLING
OTHER TIME JUST SIDEWAY MARKET
DO NOT TRADE JUST WASTE YOUR TIME & MONEY
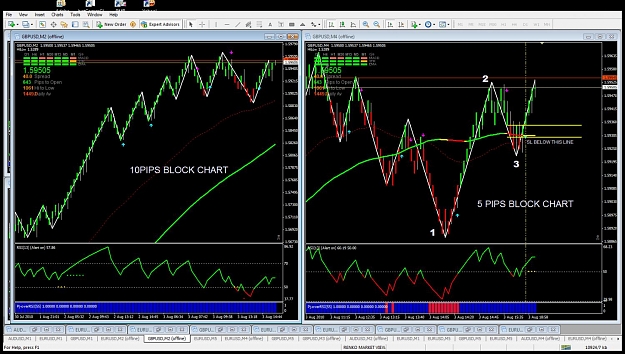
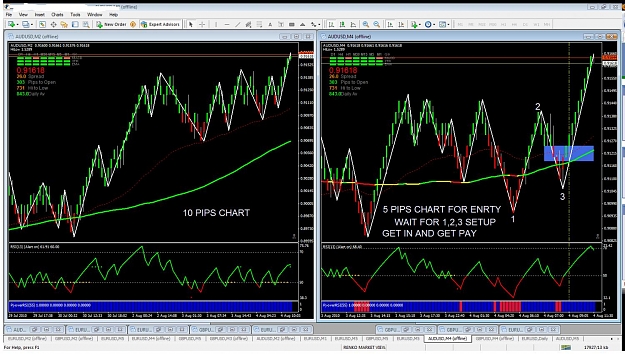
I used Range Bar, (10pips)bar FOR INTRADAY & MINIMAL RISK
Range Bar filter out the noise
Range Bar gives Price and easy to see how market behaviors
it can be 4hr if price do not move ??? so why do we care to look at 2hrs , 4hrs , 15mins , 30mins charts for ???
when price is not moving ????
all we care is the Prices
Uptrend : where Support above 55ema & 100ema = ONLY BUY with SL right below recent Support
Downtrend : where Resistant below 55ema & 100ema = ONLY SELL with SL above recent resistant
Do not trade Breakout , Breakout is the bad idea
MARKET NEVER MOVED IN STRAIGHT LINE
AFTER HIGHER/HIGH , WHAT IS NEXT ????
AFTER LOWER/LOW , WHAT IS NEXT ????
IF YOU CAN SPOT THE RED & GREEN CANDLE THEN YOU KNOW EXACTLY WHERE TO ENTER AND PLACE SL
OK, ATTACHED RENKOLIVECHART_3.2 EA TO 1MIN CHART ONLY.....
THEN CLICK ON FILE - OPEN OFFLINE CHART TO LOCATE & OPEN M2 OF THE PAIR AND APPLY THE TEMPLATE
YOU ARE READY TO ROCK
Entry & Exit Rules Please Read Post #40
cheers,
kevin
after so many trial failed and error , finally i have found the way that works for me , and i understand how the forex market works
i'd like to pay back to this community what i have learned
forex market is open 24hrs so time is not important
price is important
people always said buy dip and sell high but without the proper
technique ,,,, how to get in and what signal ????
All indicators are failed , not exactly if you know how to used it properly
i have attached a chart if anyone can see it useful then i will continue with details if not then i stop
Market Structure = Key
Failed Setup is the trade that pays most money
as you all know the law of trend
Uptrend = a series of HH & HL ,,, 1 HH do not make a trend
vice versa of Downtrend , 1 LL do not make a trend
You Don't Need to Pick TOP & BOTTOM
Structure Point and Price is the Key
NOTHING WORKS BETTER THAN CHART STRUCTURE
THAT'S HOW THE PROS DO
THE CHART IS BUILT ON STRUCTURE JUST LIKE THE BUILDING
SO THE PRICE LEVEL IS STRUCTURE
THE DIFFERENCE OF PRICE AGREEMENT THAT MOVES THE MARKET
ALL OTHER FACTORS IS NOT MATTER
OUR JOBS IS TO MAKE MONEY
TO TAKE ADVANTAGE OF THESE FAILURE AND SUCCESS OF THESE BEHAVIORS
WHERE MARKET REACTED AROUND THESE POINTS
THESE POINTS TELLS US WHERE MARKET IS GOING
THE RSI IS JUST FOR VISUALIZATION PURPOSE TO KEEP US STAY ON THE RIGHT SIDE
OF THE MARKET ,
THE KEY IS THE PRICE LEVEL OR SWING HIGH OR SWING LOW
OR S/R OR WHATEVER YOU WANT TO CALL IT
THESE LEVELS ARE VERY IMPORTANT
THIS METHOD WORKS BEST AT EACH SESSION OPEN
WHEN PRICES BREAK THESE LEVELS INDICATED
SOME VOLUME BUYING AND SELLING
OTHER TIME JUST SIDEWAY MARKET
DO NOT TRADE JUST WASTE YOUR TIME & MONEY
I used Range Bar, (10pips)bar FOR INTRADAY & MINIMAL RISK
Range Bar filter out the noise
Range Bar gives Price and easy to see how market behaviors
it can be 4hr if price do not move ??? so why do we care to look at 2hrs , 4hrs , 15mins , 30mins charts for ???
when price is not moving ????
all we care is the Prices
Uptrend : where Support above 55ema & 100ema = ONLY BUY with SL right below recent Support
Downtrend : where Resistant below 55ema & 100ema = ONLY SELL with SL above recent resistant
Do not trade Breakout , Breakout is the bad idea
MARKET NEVER MOVED IN STRAIGHT LINE
AFTER HIGHER/HIGH , WHAT IS NEXT ????
AFTER LOWER/LOW , WHAT IS NEXT ????
IF YOU CAN SPOT THE RED & GREEN CANDLE THEN YOU KNOW EXACTLY WHERE TO ENTER AND PLACE SL
OK, ATTACHED RENKOLIVECHART_3.2 EA TO 1MIN CHART ONLY.....
THEN CLICK ON FILE - OPEN OFFLINE CHART TO LOCATE & OPEN M2 OF THE PAIR AND APPLY THE TEMPLATE
YOU ARE READY TO ROCK
Entry & Exit Rules Please Read Post #40
cheers,
kevin
Attached Image(s) (click to enlarge)
Attached File(s)