DTL hold again
if its broke then 130.30 will be in target
H4 should not close below 131.71 other wise big chance to fall more
Ignored
Finally amigo Maanawi! closed my shorts at 132.20 and now Im going long at 131.70 But here i see an opportunity where the pair can go and stablish an new lower high on the daily chart to around 135.52...or even as hgh as 138.52
Finally amigo Maanawi! closed my shorts at 132.20 and now Im going long at 131.70 But here i see an opportunity where the pair can go and stablish an new lower high on the daily chart to around 135.52...
wish you and all u guys luck!
Ignored
Awesome Koko lol
just hope the setup work and good targets
if you have different TPs set it to 1st to 134.00 , 134, 90 this could be good target before another fall happen.
Good luck and thank you for always sharing your tradings
support still holding: another test of the purple line... intra-year support... as i was saying yesterday.
and again, i need to mention this: IF 131.50 area is broken (and i don't mean by 1 or 100 pips... but significantly broken), then higher timeframes are again in bearish mode. which could only mean one thing, sooner or later: test of the yearly low (126.73) and most probable a lower low for the year.
Awesome Koko lol
just hope the setup work and good targets
if you have different TPs set it to 1st to 134.00 , 134, 90 this could be good target before another fall happen.
Good luck and thank you for always sharing your tradings
Ignored
call me crazy but after ereasing all my lines and stochastics on a daily i see that could actually go as high as 139... unfortunately only patience can show us the result of our analysis...
thanks for the suggestion Maanawi god luck in your longs too I've been hedging every 35 pips spikes taking 5 pips retracements plus the spread and its working just fine...
support still holding: another test of the purple line... intra-year support... as i was saying yesterday.
and again, i need to mention this: IF 131.50 area is broken (and i don't mean by 1 or 100 pips... but significantly broken), then higher timeframes are again in bearish mode. which could only mean one thing, sooner or later: test of the yearly low (126.73) and most probable a lower low for the year.
Ignored
yup.. all and everything is aligned..
GU, AY, GY, UY.. only a small sneeze and Down we go...
if we bounce again.. then Asia = consolidation.. with possible breakout.. UY is HOT and Heavy..
[only 60pips daily move]
I'm seeing potential to break those YEN pairs even during NY session.. if not.. then we get a tea break
call me crazy but after ereasing all my lines and stochastics on a daily i see that could actually go as high as 139... unfortunately only patience can show us the result of our analysis...
thanks for the suggestion Maanawi god luck in your longs too I've been hedging every 35 pips spikes taking 5 pips retracements plus the spread and its working just fine...
Ignored
cool
mm well make the target at 140.00 for now its good area as we nearly agree
Joined May 2009
|
Status: Trading, Not Posting
|2,130 Posts
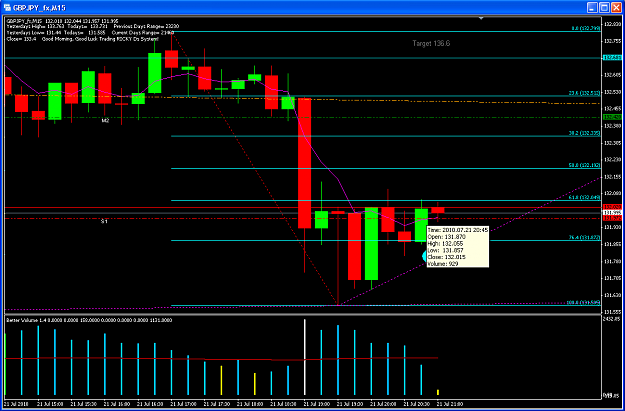
Interesting 4pm H1 close - just a smidge above the 131.99 (actionforex) support, at 132.015. The S&P stayed civil closing near it's day's lows. The bulk of Ben is out of the way, although he's still getting badgered by congressmen that can't define what they do or what Ben does.
I'm looking out for where the daily close will be at - bet it'll be right around 132, +/-1 pips. 80-100 pips up from here should be do-able. But, I still see more downside, and of course what Asia and London do is imperative. And tomorrow's another day. Should be interesting to get to the eurotests on Friday - can't wait to see the passing banks, and then their failure a couple of months down the road!
support still holding: another test of the purple line... intra-year support... as i was saying yesterday.
and again, i need to mention this: IF 131.50 area is broken (and i don't mean by 1 or 100 pips... but significantly broken), then higher timeframes are again in bearish mode. which could only mean one thing, sooner or later: test of the yearly low (126.73) and most probable a lower low for the year.
Ignored
nice setup Scrat!
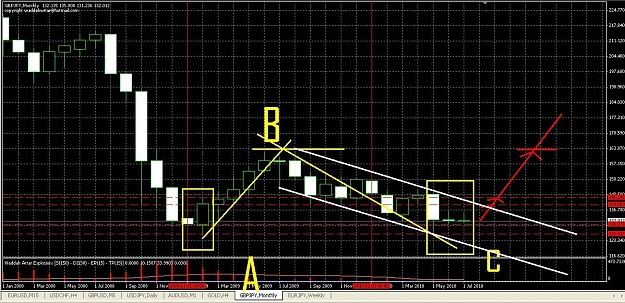
I turn to monthly chart and there chance for 17*.* as long monthly candles not closing below 125.50~30
nice setup Scrat!
I turn to monthly chart and there chance for 17*.* as long monthly candles not closing below 125.50~30
Ignored
I don't mean to be disrespectful, but I didn't say anything for the 139/140 that you threw out, and now you're throwing out 17x. as a target? On the monthly? In August? Or is it in 9 months?
What about a chart? What about the reasoning on what will get it there? What about UJ, GU levels? Will it be BOJ intervention, a disaster of some sort, a discovery of new technology? So, first it was a forecast for 800 pips away, now it's a forecast for 3800 pips away? Do you realize that readers are saying WTF is he talking about? What about the current economic/market/world environment and comparing that to when GY was at 170? Most traders can barely secure 100 pips in a run and here you are throwing out darts, with no explanation. Sure GY will get to 140, be it next year, or whenever - but if you're going to suggest it, as a veteran trader, there should be reasons listed behind the call - if it gets there it will be because of real world circumstances, not because of a line or fib on a chart. Otherwise, it's just annoying noise.
|
Joined Jun 2008
|
Status: Divergence Seeker
|1,749 Posts
I don't mean to be disrespectful, but I didn't say anything for the 139/140 that you threw out, and now you're throwing out 17x. as a target? On the monthly? Is that next month? Or, in 9 months?
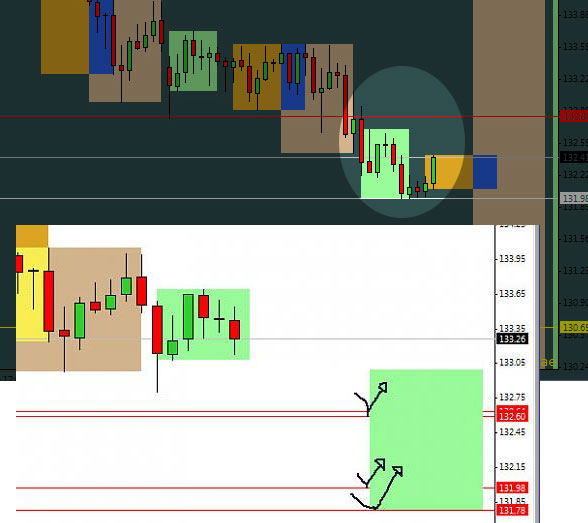
Here's an old chart of another Flush pattern for those who think this is some kind of accident. I have many charts of this pattern saved but I'll show one here.
It's an old 15 minute chart (Nov 16, 2009) of the EUR/USD. The EW count is incorrect (should be ABC waves), but it's a good example of the pattern.
I don't mean to be disrespectful, but I didn't say anything for the 139/140 that you threw out, and now you're throwing out 17x. as a target? On the monthly? In August? Or is it in 9 months?
What about a chart? What about the reasoning on what will get it there? What about UJ, GU levels? Will it be BOJ intervention, a disaster of some sort, a discovery of new technology? So, first it was a forecast for 800 pips away, now it's a forecast for 3800 pips away? Do you realize that readers are saying WTF is he talking about? What about the current economic/market/world...
Ignored
if it gets there it will be because of real world circumstances, not because of a line or fib on a chart. Otherwise, it's just annoying noise.
hope not to see fibo again on your chart, do you really mean what you wrote??!!
av you forgot most of my posts in here?
its up to me to show my setup or not, plus my posts is a history front of any one to decide how right I'm in average(go check my posts on EUR USD thread) , so dont think all will say WTF!!
let me show you this img again but please dont forget about X & Y , time and price even Its adjust by exact hour but i didnt draw it the best and I wont to share these easy examples again.
and about news I leave them for you.
oh by the way its Auslanco GU GY not Auslanco Attack area
The only opportunity that I saw today in gbp/jpy was in early european session when the pair hit 132.86, formed 123 and go long above that high on 15 minute chart. 40 pips of meat. Although looking at 8 hour and daily chart the picture is very bearish. I smell a breakout down sooner rather than later.