John, the red and green arrows are not fractals--they represent breaks of fractals. The red arrow indicates a break below the previous fractal low, and the green arrow indicates a break of the previous fractal high. The fact that they happen on the same bar just indicates that the price action was volatile enough to take out both the previous fractal high and low within that time period.
This is all explained better in Stratman's dashboard manual in "Appendix 3 Fractals". To visualize what is happening more clearly, you might want to include...
Hello,
I loose my long post because of computer problem, so I will be short...
First, Thanks for the good job made by stratman. I purchased the PipwareDB 2 days ago and It seems fantastic, complete and -for the moment- without any bug! So Im happy to work with it, and will spent time to learn how to use it, even if I read all the posts here and the manuel(english is not my native langage).
I m new registered in the FF forum but "old reader". I use the THV4 and would like to "mix" THV4 and Pipware DB in the same template.
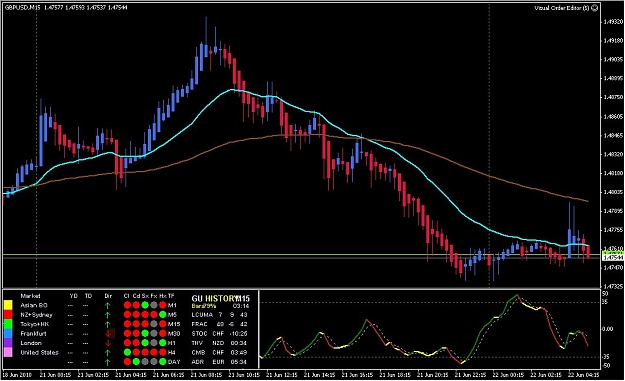
In fact, I would like to use the minicharts with indicators, the DB, the news master, the THV Trix with divergences, the HA chart with THV pivots and Pipware fractals and have the alert panel on the 0 window.... Maybe it seems complicated. Does someone manage to do it? And could you share a template? (I m trying to do it by myself but not sure to be good with the x, y and corner to have a clean screen ).
Thanks a lot if you can help or give me a link if i missed it (i don't think so!)
cheers,
Math
Joined Jan 2010
|
Status: Yet to replace my suit in black....
|3,268 Posts
Hi Rob,
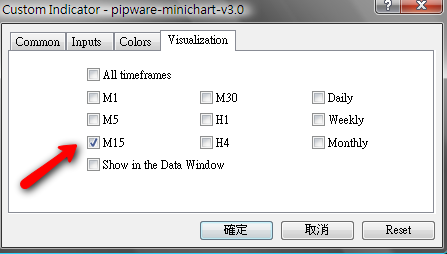
Just wonder whether it is possible to fix the display of minichart on particular time frame, say only on M15. Even I change the setting like the pic below, it does appear on all time frame.
Hi Buildcity, I don't expect to add more code to this older indicator as I concentrate my efforts on the less resource intensive 'pipware-charts' these days.
Just wonder whether it is possible to fix the display of minichart on particular time frame, say only on M15. Even I change the setting like the pic below, it does appear on all time frame.
In fact, I would like to use the minicharts with indicators, the DB, the news master, the THV Trix with divergences, the HA chart with THV pivots and Pipware fractals and have the alert panel on the 0 window....
Math
Ignored
Please refer to my earlier posts #1221 (page 82), #1491 (page 100), #1703 & #1707 (page 114).
If you like any combinations, please drop me a note.
Thanks for your answer!
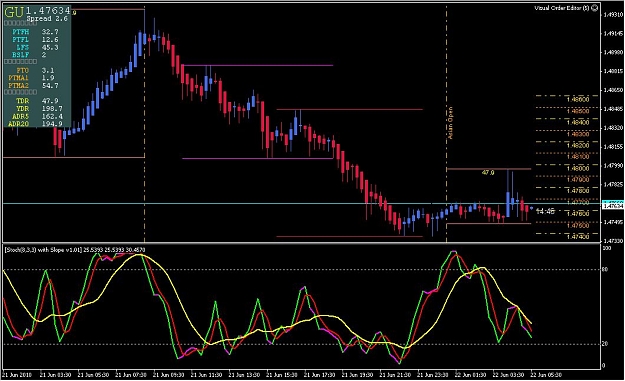
I was looking after a way to put the minicharts with indicators (macd or TDI, or Trix...) on the right of the main chart (at the place,on my picture, you can see minicharts with MA).
Not found yet.
cheers
Math
My MT4 had a problem, after switching from demo to real account, the DB4.3 display "history" error on those charts that was previously in the demo version, but works fine on other 'new' chart. It also 'disable' the Asian. London sessions etc. hour lines (which I need). Its now more than one month, how to correct the error!!!
In the mean time I am using other indicators the replace the shortfall.
the 'history' text is quite normal when you start a new price feed ie you were using a demo price feed and now changed to a brokers live price feed.
The dashboard relies on having a minimum of 30 trading days worth of H1 data. This can take a little while to be brought down from the brokers server.
You can force the H1 bar history to be updated more quickly by following the instructions on page 4 of the manual where the 'history' message is discussed.
My MT4 had a problem, after switching from demo to real account, the DB4.3 display "history" error on those charts that was previously in the demo version, but works fine on other 'new' chart. It also 'disable' the Asian. London sessions etc. hour lines (which I need). Its now more than one month, how to correct the error!!!
In the mean time I am using other indicators the replace the shortfall.
I read your post again. Are you saying that you have been running one full month on a live account and the dashboard does not show data for some currencies?
I have not heard of this problem before but if so, I would suggest that somehow your MT4 history has possible become corrupted? Only thing I can suggest is to reinstall your MT4 into another directory (fresh install) and see how it behaves with only having a live feed ie live account only (never using demo account for that install)
My MT4 had a problem, after switching from demo to real account, the DB4.3 display "history" error on those charts that was previously in the demo version, but works fine on other 'new' chart. It also 'disable' the Asian. London sessions etc. hour lines (which I need). Its now more than one month, how to correct the error!!!
In the mean time I am using other indicators the replace the shortfall.
Quote
[6/19/2010 2:52:03 AM] formulaonefan: do you know of any programme for MT4 that would send email alert when price reaches a particular level?
Quote
I noted this request in the Skype discussion, and would like to share a short video that explains how to set alarms on the computer, you can try the email alert.
just bought pipware for 2 weeks, and new to the indicator and forex. i have studied from manual and forexfactory a lot,
it not clear to me "frac 30 -17 -13" (last swing, lower, upper as in manual)
how can i identify these numbers for the current tf?
thanks very much.
Ignored
Witprint,
The first number ("30" in this case) is the pip range of the last fractal swing, from low-to-high or high-to-low. The second number ("-17") is the distance, in pips, from the current price to the last fractal low. The third number ("13") is the distance, in pips, from the current price to the last fractal high.
These numbers are useful if you are using the fractal breakout strategy outlined in Stratman's manual. If the second or third numbers are approaching "0", then the current price is on the verge of possibly breaking a fractal high/low, which could lead to trend continuation or reversal. In addition, since fractal formations are typically areas of S/R, these numbers tell you how close you are to these key levels, and it is up to you to decide how, or if, you want to trade in relation to them.
At any rate, the numbers always apply to the current timeframe.
When people warned me that dukascopy are very 'anal' about their paper work I should have taken more notice
Finally, my docs arrived by international courier to dukascopy beginning of last week. Bad timing as the agent assigned to me was away (all week). Finally spoke to him yesterday but was informed that my docs aren't acceptable
My name on the application is 'Rob' but my certified ID (passport) was my full first name 'Robin' ... therefore not acceptable!
The disappointing thing is that I sent copies of my ID docs by email first ie so they could be checked against the application before going to time and expense of the courier. Unfortunately, the error wasn't picked up.
Now I am filling out docs again today with my full name. They have to be sent by international courier ... so another long wait (5 days).
I have asked for a change of dukascopy agent. Someone a friend uses and has had no trouble with. I sent my docs to this agent (by email) to verify before sending by courier.
When people warned me that dukascopy are very 'anal' about their paper work I should have taken more notice
Finally, my docs arrived by international courier to dukascopy beginning of last week....
Ignored
They are definitely tight. Even their demo software locked me out after ~3 failed attempts to remember my password. It was a little too much for me, but I'm sure you'll be happy once your account is finally setup.
Hello Rob,
I have been trying to find a way to create an indicator to draw horizontal lines on the chart from start of day candle till end of day candle.
Will be grateful if you can direct me to any literature or lesson on line to be able to do this.
Want also to be able to draw them back in history.
Thank you.