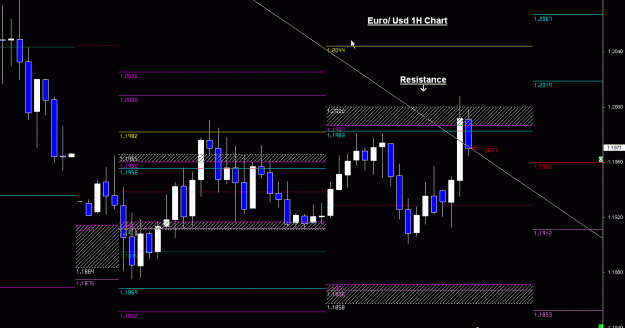
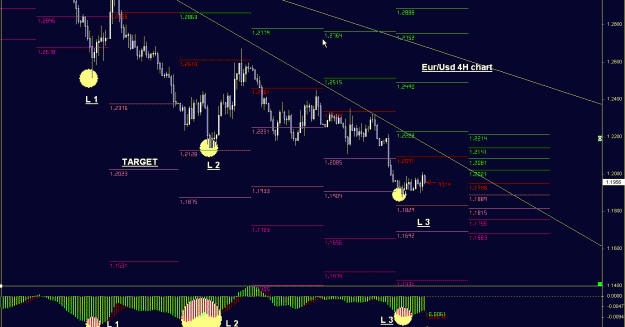
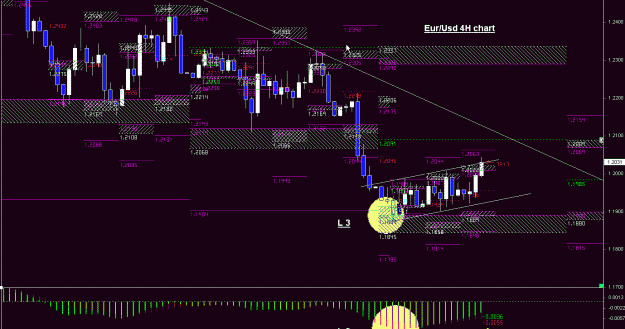
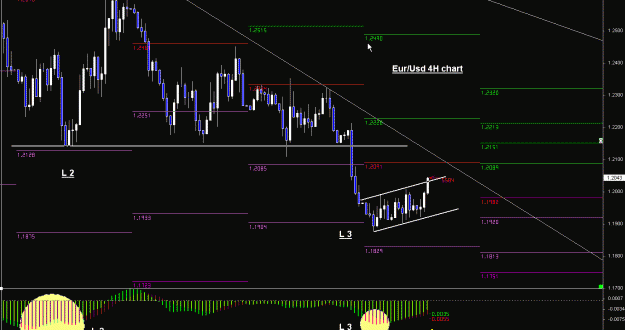
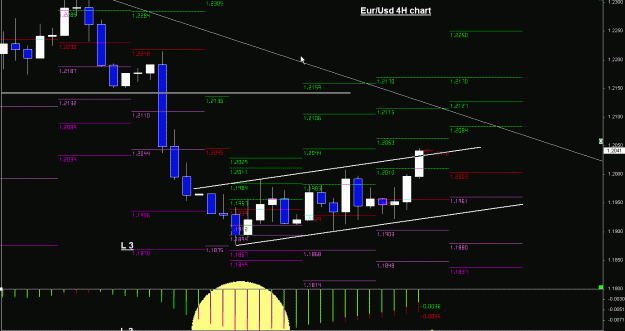
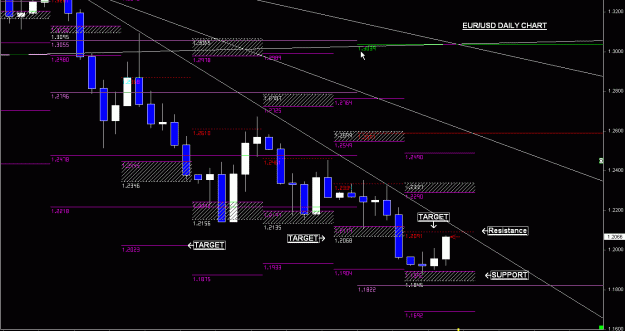
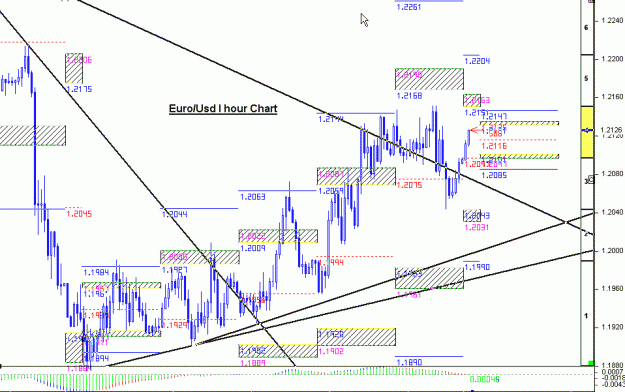
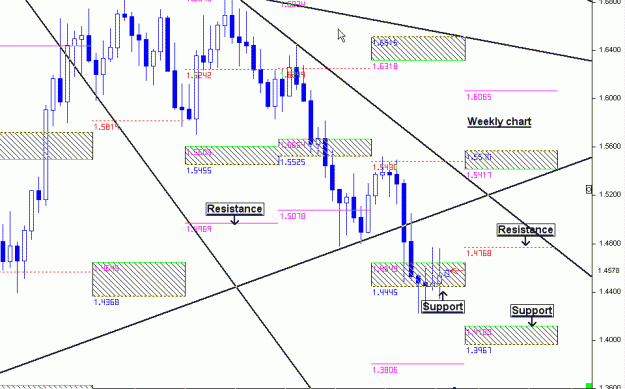
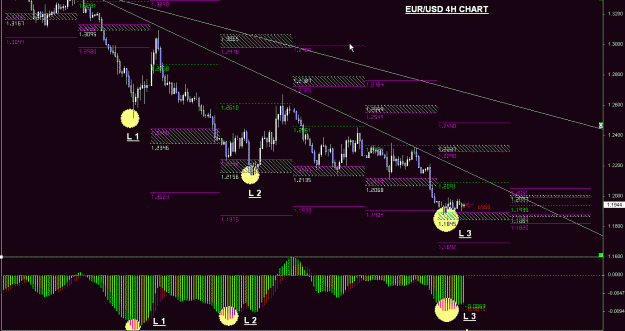
Euro find support at 1.1875, Usd/Chf unable to stay above 1.1585, Euro aiming at 1.2023.I am long euro to 1.2014. Good luck to me and you all. My first trade for the week
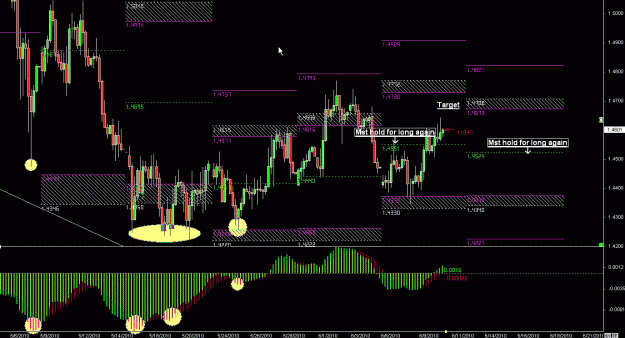
Attachment
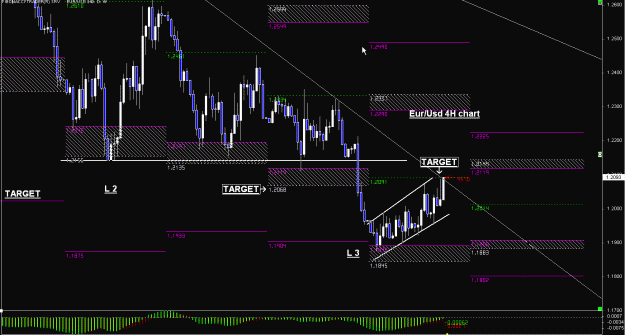
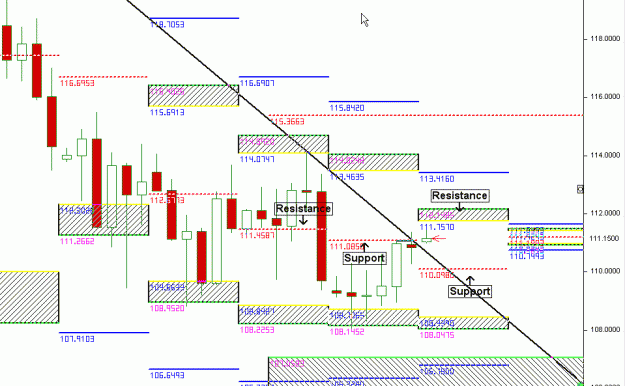
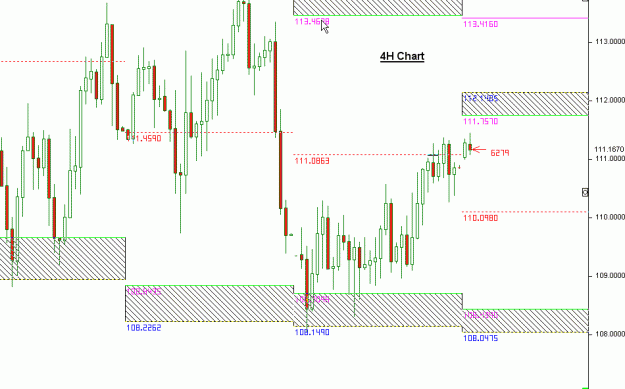
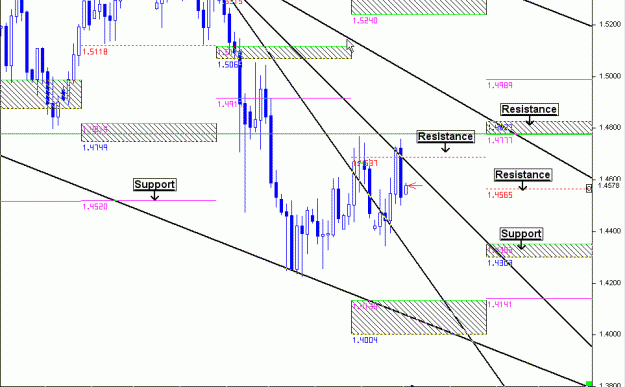
Attached Image (click to enlarge)
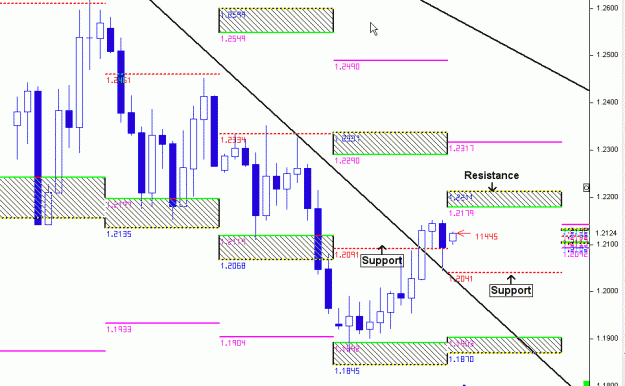
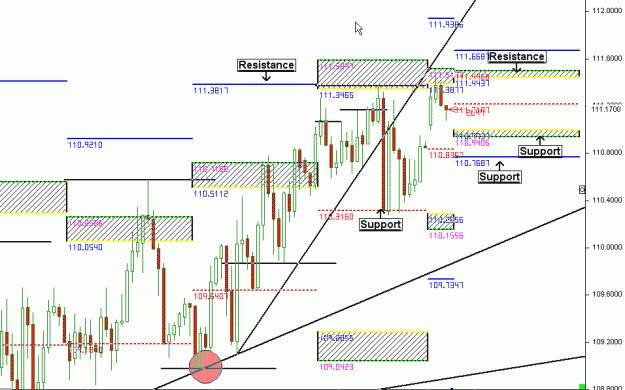
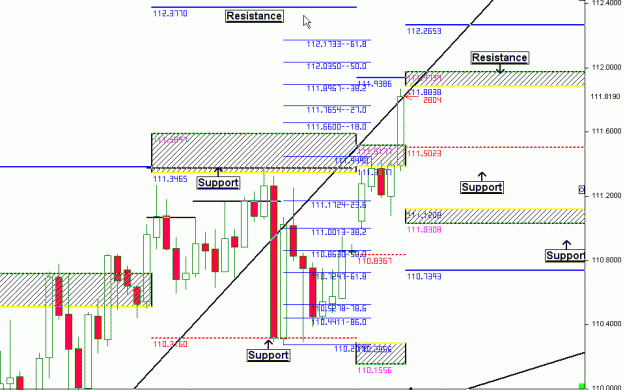
Attached Image (click to enlarge)
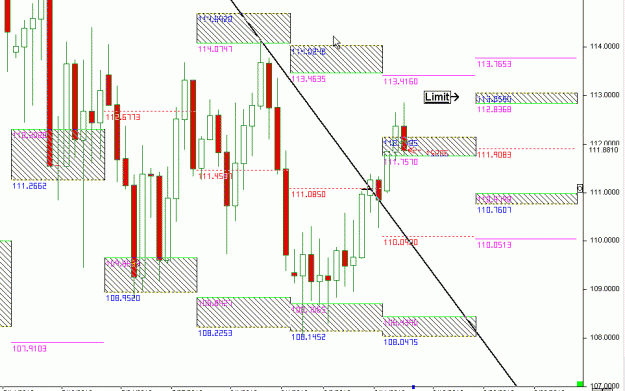
Attachment