Hi,
Wanting to explore this some more.... here's the rules for the very mechanical system.
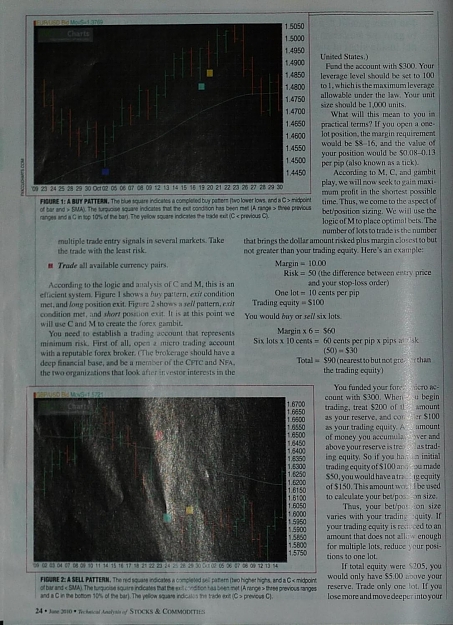
Buy: Buy two lower lows and a closing price that is greater than the midpoint of the bar and is above the SMA (30, or maybee user set?)
Exit Long: When a bar occurs whose range is greater than the previous three ranges and whose close is in the top 10% of the bar, exit a long position on the first closing price that is lower than the previous closing price OR exit after 16 days.
Could somebody program some indicators that paint a Dot/Tick/Arrow under the buy, under the bar whose range is > 3 last and top 10% and then the bar after this one that is the actual close? we can do some manual visual backtesting and then go from there.
Easy to do? I hope so! If it works well maybe we can develop it more into an EA with MM etc.
Thanks
Stuart
Wanting to explore this some more.... here's the rules for the very mechanical system.
Buy: Buy two lower lows and a closing price that is greater than the midpoint of the bar and is above the SMA (30, or maybee user set?)
Exit Long: When a bar occurs whose range is greater than the previous three ranges and whose close is in the top 10% of the bar, exit a long position on the first closing price that is lower than the previous closing price OR exit after 16 days.
Could somebody program some indicators that paint a Dot/Tick/Arrow under the buy, under the bar whose range is > 3 last and top 10% and then the bar after this one that is the actual close? we can do some manual visual backtesting and then go from there.
Easy to do? I hope so! If it works well maybe we can develop it more into an EA with MM etc.
Thanks
Stuart