• Home
  • Forums
  • Trades
  • News
  • Calendar
  • Market
  • Brokers
  • Login
  • Join
  • User/Email: Password:
  • 6:14pm
Menu
  • Forums
  • Trades
  • News
  • Calendar
  • Market
  • Brokers
  • Login
  • Join
  • 6:14pm
Sister Sites
  • Metals Mine
  • Energy EXCH
  • Crypto Craft

Options

Bookmark Thread

First Page First Unread Last Page Last Post

Print Thread

Similar Threads

Convert afl file to mq4 file 23 replies

Need little help to modify indicator to read csv file 3 replies

EA to read CSV file and plot values in indicator window 45 replies

MetaTrader 4, mq4 File to Esignal EFS File 0 replies

how to include a file.txt in an mq4 file ?? 6 replies

  • Platform Tech
  • /
  • Reply to Thread
  • Subscribe
  • 14
Attachments: Indicator to read from file
Exit Attachments

Indicator to read from file

  • Post #1
  • Quote
  • First Post: May 11, 2010 1:57pm May 11, 2010 1:57pm
  •  Ilovepippin
  • Joined May 2008 | Status: Gannalist | 1,176 Posts
Guys,

I have a question:

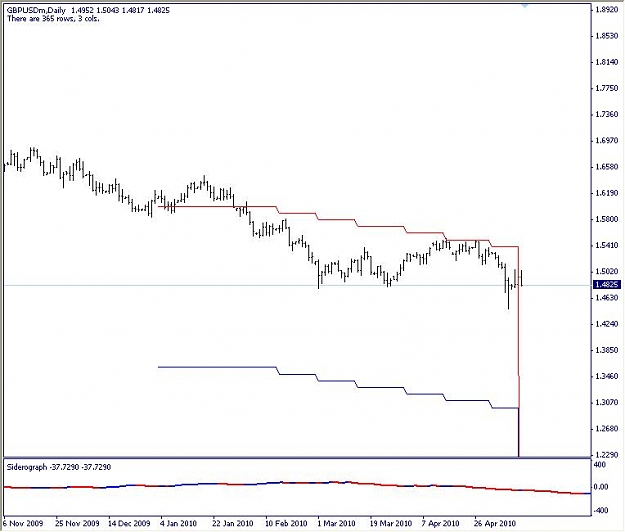
I have a file with date, pricelow, pricehigh values and want an indicator to read from that external file and plot lines on the main window.

Is that possible, does such an indicator exist?

Thanks!
  • Post #2
  • Quote
  • May 12, 2010 6:25am May 12, 2010 6:25am
  •  sangmane
  • Joined Apr 2009 | Status: MT4 Programmer | 758 Posts
yes it is. take a look at this thread http://www.forexfactory.com/showthread.php?t=230357

it will be better if you can upload the sample file (in CSV format) along with a pic that illustrate how the line should be drawn
 
 
  • Post #3
  • Quote
  • May 12, 2010 10:35am May 12, 2010 10:35am
  •  Ilovepippin
  • Joined May 2008 | Status: Gannalist | 1,176 Posts
Sangmane, my friend, thanks for your reply!

The previous project you helped me on is doing great!

This one is a little different. I found on the web an indicator that draws cycle lines of planets in an indicator window.

I want something similar, but on the chart itself, like on the picture, same way moving averages are displayed.

The file would look like this:

date - price low - price high
01012010 - 1.6000 - 1.7000

The file I will extract from an excel file and dump it into .csv

I attached the indicator that I found and it has an option for multiple files, that would actually be perfect.
Attached Image (click to enlarge)
Click to Enlarge

Name: gbpusd 050510-daily.jpg
Size: 63 KB
Attached Files
File Type: mq4 Astro.mq4   6 KB | 559 downloads
File Type: txt mercure.txt   20 KB | 506 downloads
File Type: txt Venus.txt   22 KB | 427 downloads
 
 
  • Post #4
  • Quote
  • May 12, 2010 12:21pm May 12, 2010 12:21pm
  •  sangmane
  • Joined Apr 2009 | Status: MT4 Programmer | 758 Posts
below are two files, the indicator that will draw two lines based on csv data, and the sample csv file that contain 16 rows of data. save csv file to expert/files folder.

the important thing is the first column of csv data must contain date in the format "yyyy.mm.dd".

if your original data is in excel, you can export it to csv. before export to csv, make sure to change the date format by using format cell- number-custom. the indicator don't make a date conversion.

hope this help
Attached Files
File Type: mq4 #DataPlotter.mq4   2 KB | 543 downloads
File Type: csv data.csv   < 1 KB | 548 downloads
 
1
  • Post #5
  • Quote
  • May 12, 2010 2:26pm May 12, 2010 2:26pm
  •  Ilovepippin
  • Joined May 2008 | Status: Gannalist | 1,176 Posts
Quoting sangmane
Disliked
below are two files, the indicator that will draw two lines based on csv data, and the sample csv file that contain 16 rows of data. save csv file to expert/files folder.

the important thing is the first column of csv data must contain date in the format "yyyy.mm.dd".

if your original data is in excel, you can export it to csv. before export to csv, make sure to change the date format by using format cell- number-custom. the indicator don't make a date conversion.

hope this help
Ignored
Thanks for this Sangmane.

However, the line is not showing on the chart.
It will recognize the file but no line is visible.
 
 
  • Post #6
  • Quote
  • May 12, 2010 2:45pm May 12, 2010 2:45pm
  •  sangmane
  • Joined Apr 2009 | Status: MT4 Programmer | 758 Posts
check the following:
1. atached on daily chart, because the date on first column is a date without hour/minutes
2. the high/low column (2nd and 3rd column) has a value that visible on the chart. if you fill 2nd/3rd column with value = 97.89 and attached the indicator on EU chart, you'll not see the line

below is a screenshot taken on EU daily using the data.csv that i posted above
Attached Image (click to enlarge)
Click to Enlarge

Name: temp.gif
Size: 6 KB
 
 
  • Post #7
  • Quote
  • May 12, 2010 4:00pm May 12, 2010 4:00pm
  •  Ilovepippin
  • Joined May 2008 | Status: Gannalist | 1,176 Posts
Aha, now it is working.
I did not have it on the correct timeframe.

Problem though. It does not project the future trend.
The file has data until December 31, 2010 and on the chart that shows as a steep line downward.

Also, do you think we can open more than one file at the time?

BTW these are Saturn channels. They work quite well on gbpusd.

Thanks!
Attached Image (click to enlarge)
Click to Enlarge

Name: gbp.jpg
Size: 47 KB
 
 
  • Post #8
  • Quote
  • May 13, 2010 8:49am May 13, 2010 8:49am
  •  Ilovepippin
  • Joined May 2008 | Status: Gannalist | 1,176 Posts
Sangmane,

I have fixed it by using the "indexshift" function, that way the graph does not drop off after the last bar.

But do you know of another way?

Thanks!
 
 
  • Post #9
  • Quote
  • Edited at 3:13am May 14, 2010 3:11am | Edited at 3:13am
  •  sangmane
  • Joined Apr 2009 | Status: MT4 Programmer | 758 Posts
i've modified it. indicator attached below will automatically calculate the appropriate shift amount based on the latest date in the data

pls share how you use this planetary strategy
Attached Image (click to enlarge)
Click to Enlarge

Name: temp.gif
Size: 9 KB
Attached File
File Type: ex4 #DataPlotter.ex4   3 KB | 343 downloads
 
1
  • Post #10
  • Quote
  • May 14, 2010 8:31am May 14, 2010 8:31am
  •  Ilovepippin
  • Joined May 2008 | Status: Gannalist | 1,176 Posts
Quoting sangmane
Disliked
i've modified it. indicator attached below will automatically calculate the appropriate shift amount based on the latest date in the data

pls share how you use this planetary strategy
Ignored
Thank you Sangmane.

They are really support/resistance lines.
The theory is that from Jeanne Long who studied Gann and Gann was known to use planetary cycles in his trading.
He was a big believer in the theories of Faraday. Faraday at his time had a knowledge of magnetic fields way ahead of his time and Gann found a way to use that in trading.
Magnetic fields influence people much more than we want to acknowledge through modern science and Gann knew that.

You can calculate the orbits of the planets and connect them to price. That is what I did on this particular cycle and it works very well for gbpusd.
I now need to do all the other planets...

Thanks!
 
 
  • Post #11
  • Quote
  • May 14, 2010 8:38am May 14, 2010 8:38am
  •  Ilovepippin
  • Joined May 2008 | Status: Gannalist | 1,176 Posts
Here is a nice project for you to study.
I found it on a russian forum. Seems to work well.

Also I will include my data file for saturn for the indi you made.
Attached Files
File Type: zip 298537-PlanetLine.zip   8 KB | 620 downloads
File Type: csv data.csv   8 KB | 437 downloads
 
 
  • Post #12
  • Quote
  • May 14, 2010 10:14am May 14, 2010 10:14am
  •  sangmane
  • Joined Apr 2009 | Status: MT4 Programmer | 758 Posts
thanks for the strategy. will take a look at it
 
 
  • Post #13
  • Quote
  • May 30, 2010 2:58am May 30, 2010 2:58am
  •  tts123
  • | Joined Dec 2008 | Status: Member | 26 Posts
Quoting Ilovepippin
Disliked
Here is a nice project for you to study.
I found it on a russian forum. Seems to work well.

Also I will include my data file for saturn for the indi you made.
Ignored
Hi Ilovepippin,

Most of The files from Russian forum can't be compiled?

tts123
 
 
  • Post #14
  • Quote
  • Last Post: Jun 6, 2012 7:02pm Jun 6, 2012 7:02pm
  •  Ilovepippin
  • Joined May 2008 | Status: Gannalist | 1,176 Posts
Hi Sangmane,

I am using this indi to display studies that I make on this software: www.timingsolution.com

I studied a cycle that is 83% correlated to the markets.
I plotted the data onto the chart. This is what it looks like:
Attached Image (click to enlarge)
Click to Enlarge

Name: 2012-06-06_18-49.jpg
Size: 157 KB
Attached File
File Type: csv data.csv   43 KB | 306 downloads
 
 
  • Platform Tech
  • /
  • Indicator to read from file
  • Reply to Thread
0 traders viewing now
Top of Page
Forex Factory Blog Updated: Alerting All Members
  • Facebook
  • Twitter
About FF
  • Mission
  • Products
  • User Guide
  • Media Kit
  • Blog
  • Contact
FF Products
  • Forums
  • Trades
  • Calendar
  • News
  • Market
  • Brokers
  • Trade Explorer
FF Website
  • Homepage
  • Search
  • Members
  • Report a Bug
Follow FF
  • Facebook
  • Twitter

FF Sister Sites:

  • Metals Mine
  • Energy EXCH
  • Crypto Craft

Forex Factory® is a brand of Fair Economy, Inc.

Terms of Service / ©2022