Just a thought - SL just below dpp @ 133.18. . . seems last nights low would be a good target for SL 133.00 area. . .
Looking at PA it's slow and at the moment doesn't look nowhere near bearish at this level IMO more like consolidation or accumulation in this range picking up more buyers for a strong push up thru resistance. . . IMO!
Ignored
Yes, more buyers is picking up. I think broker saw my pickup low then go hunt my SL@BE. ahhahah...Well, wait for new setup once we confirm bull is on the way. Trade safe .
If London can't put in a new low below 133.03/06 then we will see NY drive price back up above 134 after lunch. . .
Price currently trading above dpp @ 133.13 and the swing above is ar'd 135.18. . .
Good luck on your trading. . .
Ignored
That sounds right to me as well.... Waiting now to see if we take off on a bull hourly run...Average pips are around 80 up to 120 for this hour so if we take off we could see 134.30 by the end of the hour.. of course if we break below the LTL of this triangle then we can easily see 132.80 level...
I am thinking that the probability is 134.30 withing the next 30 minutes... Any takers??/
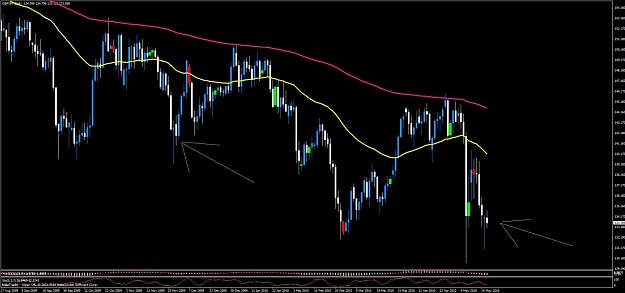
We're definitely attempting to put in a base here on the 4H chart. Right now, that's the lowest timeframe that seems to have any clear direction to me right now. Everything else could definitely use a larger retracement and 136-138 is not out of the question... I'd actually probably favor somewhere in between the two.
Once the retracement completes I'd have to take a new look. There's a downtrend channel resistance at 144 or so and we could go up and test that... it depends on how much she wants to run. But long-term the bias is be definitely bearish and if we did get to 144 area I'll definitely building shorts like last time.
But right now PA continues to try to dip lower but gets bought back up pretty quickly. 133 is key but 133.30ish is looking like it's being bought up on every little trip down.
For Quecee - I have been looking through the FF archives and have been unable to find a fibo retracement tool as neat as yours. Is there any chance you could point me in the right direction please? The MT4 standard fibo tool is a bit to basic.
Or do you plot them manually?
Thanks in advance.
Ignored
It's the standard fib retracement. . . You can go in a put in the ext. but it's contained in this template so should be good to go. . .
We're definitely attempting to put in a base here on the 4H chart. Right now, that's the lowest timeframe that seems to have any clear direction to me right now. Everything else could definitely use a larger retracement and 136-138 is not out of the question... I'd actually probably favor somewhere in between the two.
Once the retracement completes I'd have to take a new look. There's a downtrend channel resistance at 144 or so and we could go up and test that... it depends on how much she wants to run. But long-term the bias is definitely bearish...
Ignored
Nice observation I'm noticing that PA is reluctant to go below the dpp at this point and the daily swing - swings up to at least 135.18 for now @ R1 which will be the 1st test of rsistance if we don't get a push down before London packs it in. . . Like I stated if London doesn't put in a new low NY should make a push back above 134 hopefully. . .
I think NY will push price back above 134 and hopefully close above 134.30 area on a daily close. . . My target is 1.618 if we get above 134.30 and close there. . Other targets are 137.50 then back to 139.50 for a test if we get above 135.88/136.60 area. . .
not so fast bro..
seams EUR has a SONG to finish.. 1.20
Ignored
So where does that leave sterling bro and USD? PA looks slow on the down move but anything is possible meaning momentum could easily pick-up but so far PA has been respecting the dpp and a close above it I think we swing up to at least the daily swing minimal in NY or maybe in Asia depends on the NY close. . .
|
Additional Username
|
Joined Apr 2010
|722 Posts
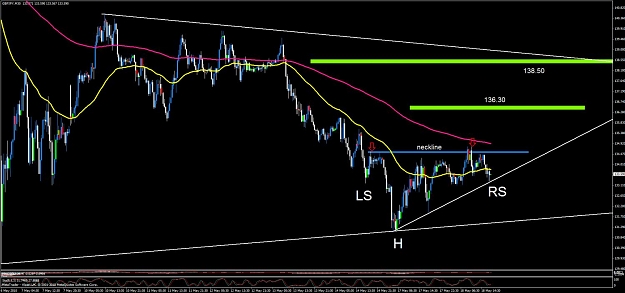
technical speaking,must we go upto 135 to 138.50 ...all the signs are there for the deep pullback/ back in consilidation mode...but lol,anythin can happen and we can see 132 or where ever ...
we have a scruffy H&S on 1 hour ,with the prev high has been taken out and we retrace now to form the right shoulder ,,so we should turn around in the next hours and 133.10 should hold it,,if not then bears are back in control ...
im sorry for the bears,,but do you guys know how much pips($) is there if we heads to 138.50 ...its sickening ,,then we all know excactly the lows and highs of the trinagle and we know when is the breakout and we know where is the target ... ,,if we heads now lower,,it will be a slow gay move to 130 and im not bother to short it ..
but thats how it goes,and we wait for aonther monster breakout ...
im long now,,but im not bother if a made 1 pip or 400.. i want it to go 138.50 ,ao we can short the living hell out of it and add on every rally at 78.6 so that she knows she been adding,and oh dont forget the breakout ..we wont even stopped at 130 ,bang str8 to 125 with a spike to 123.80 ..done .. go on holiday and relax for some days
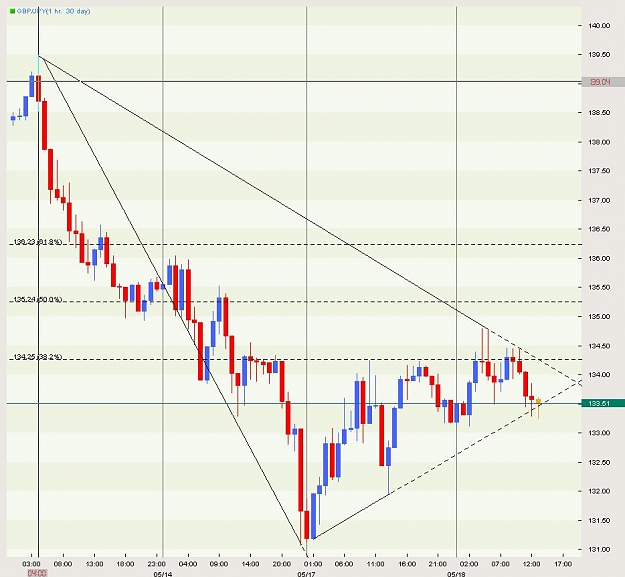
Well we first have a bearish channel on the hourly chart to take care of. We will need to break the UTL at around 134.20 this time around... Also 133 must hold to help validate this...
after ny will close today, the key level to downside will be 131.90. also, until next london session will close, key level to upside is 134.80.
IF we go up, then it may test very well 138.45 - upper limit of medium term channel. a break of 138.45/140.56 will bring a test of 143.25... but this is too far for me.
We're definitely attempting to put in a base here on the 4H chart. Right now, that's the lowest timeframe that seems to have any clear direction to me right now. Everything else could definitely use a larger retracement and 136-138 is not out of the question... I'd actually probably favor somewhere in between the two.
Once the retracement completes I'd have to take a new look. There's a downtrend channel resistance at 144 or so and we could go up and test that... it depends on how much she wants to run. But long-term the bias is be definitely...
|
Additional Username
|
Joined Apr 2010
|722 Posts
this give me hope for the bulls...a similiar daily setup/canldes.. look on my chart ...so 2morrow should we have a 200 pip candle up north ,according to the prev setup
after ny will close today, the key level to downside will be 131.90. also, until next london session will close, key level to upside is 134.80.
IF we go up, then it may test very well 138.45 - upper limit of medium term channel. a break of 138.45/140.56 will bring a test of 143.25... but this is too far for me.
IF we go down, well, buckle up for a new low...
Ignored
Pretty much exactly how I'm seeing it. Right now I'm favoring some upside and as you said a break of mid-term channel is too far for me to think about right now too, but I understand it as a possibility... just not going to stick my neck out on thinking it will materialize (not yet anyhow).
this give me hope for the bulls...a similiar daily setup/canldes.. look on my chart ...so 2morrow should we have a 200 pip candle up north ,according to the prev setup
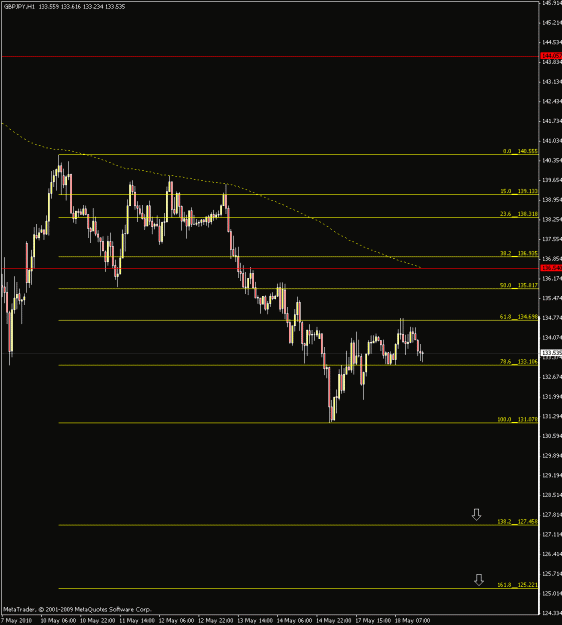
Looking at the swing hi/lo from the last wave 140.55 - 131.07 if yu plot a 200 SMA on the chart price has not traded above it on the 1hr chart since May 5th 2010 and has respected it every since. . .
If you look at where the 200 SMA is calling for price on avg and on this retracement (if we don't crash thru 133 with a close below dpp) one can see clearly that 136.50 - 136.95 on a spike could be max retrace up and would line up with the 4th wave up completion for preparing for a 5th wave down below 130. . .
As pointed out we can spike up (more than likely in overnight trading) but if we get a close below the recent established range which is 135.88 - 129.22 then we are back in business for the bearish continuation.
I can only see price heading to 138 area if we get a weekly close above the 200 SMA and if that is the case I would think it would mean reversal.
Also if you plot a fib from the swing high and low the 50% retrace from the swing lo represents 135.81 and the 61.8 fib retace is 136.93. . . the 200 SMA is right between those which tells me that 135.81 could be the target with a spike to touch the 200 SMA with a daily close below it. . .
Just my thoughts about the 138 target many have mentioned here. . .
Also lines up with said targets of 127.50 and 125 @ 138.2 and 161.8 for a 5th wave touch. . .