Dislikedthanks. it makes sense, if you come to think of it - forex markets never close between monday (first nz orders) and friday (last us orders), so to speak of a daily close is not quite accurate... i know i am going against the conventional wisdom here, but this is how things are.
for classic charts, i would say everything below weekly is noisy. daily could be a very powerful tool for entries/exits only if we watch and correlate between major sessions - something like my previous charts with squares all over the chart. but below daily... well......
Ignored
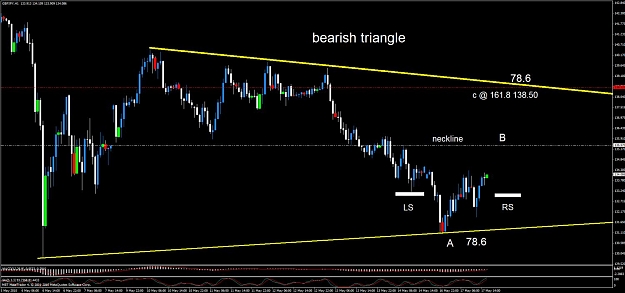
scrat,,if i take your view of above 135.56,then you said we are in for more of a consilidation period of a higher PA ... so that line up with my view of 138.50 .. then your 135.56 is the neckline of inverted H&S and your ABC is right on the 78.6 at 138.50 inside the triangle ...
so im not bother now to try shorts at 136 if we take out the high of 135.56,,, we will most likely retrace at 135.56 and form the right shoulder ,and then impulsive wave C to 138.50 ...
here is the chart of my explanation ...
Attached Image (click to enlarge)