Before I go into the topic, I would like to highlight that this thread is not going to discuss any trading systems but the scientific method to exploit the optimal profit potential of a quantitative trading strategy.
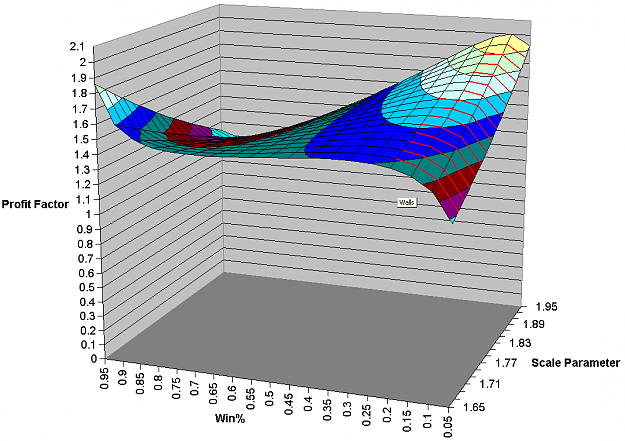
Like many of you here, I suspected that there could be an optimal profit factor for a systematic trading system. I have done a lot research and I came out this one, the profit factor phase space.
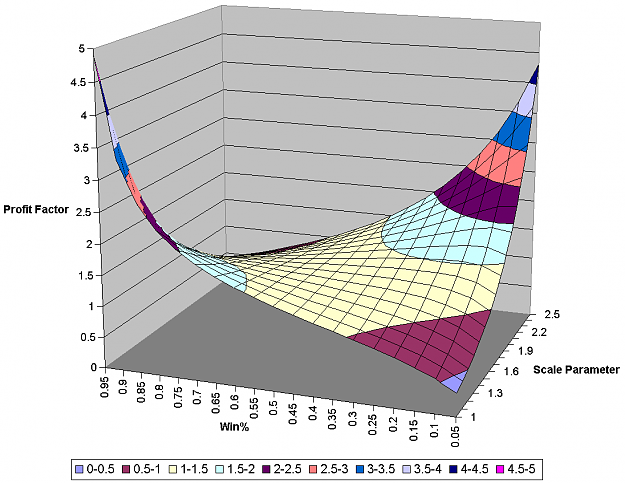
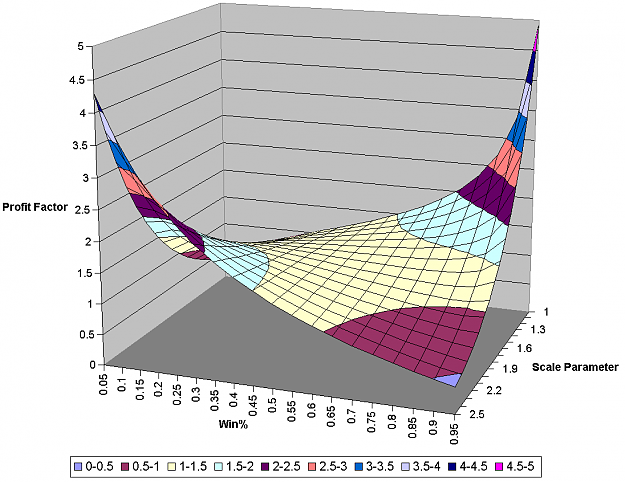
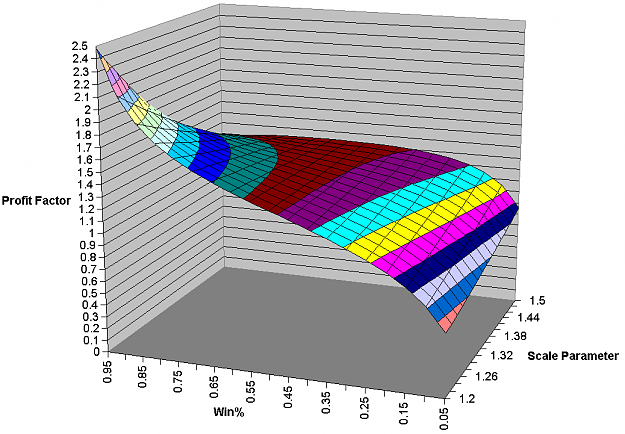
Here are the sample profit factor phase space for my quantitative model. Both charts are the same but at different angle of view. Btw spread is not taking into consideration in these charts so that i can minimize the external interference that distort the true statistical behaviour of my model.
I just wonder any of you did a similar study on your trading strategy? Let's talk.
Like many of you here, I suspected that there could be an optimal profit factor for a systematic trading system. I have done a lot research and I came out this one, the profit factor phase space.
Here are the sample profit factor phase space for my quantitative model. Both charts are the same but at different angle of view. Btw spread is not taking into consideration in these charts so that i can minimize the external interference that distort the true statistical behaviour of my model.
I just wonder any of you did a similar study on your trading strategy? Let's talk.
Attached Image(s) (click to enlarge)