Earlier today I posted this in my journal thread Watch the rise (or fall) of a trader gone naked. I posted it in this forum to initiate a broader discussion about it.
Facts:
- Price moves up or down.
- Price moves more up than down in an uptrend.
- The direction of the trend can easlily be spotted on a chart. One can also use a Moving Average for indication.
OK, the above is clear to me. In an uptrend I take a long position, right?
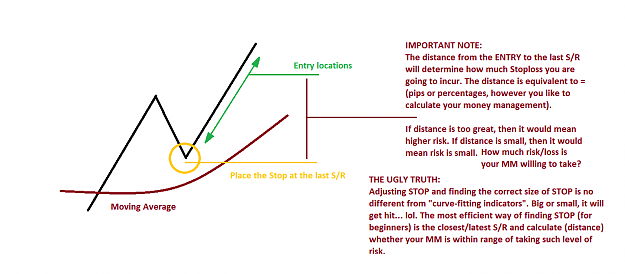
What about stops (Money Management)? If I get stopped out, I should be able to get in again later at the same price when the trend direction resumes. The key problem here is the difference between the entry price and the stop. It should be small enough to protect my money if the price moves to far in the wrong direction, and large enough to keep me from getting stopped out too early. This discussion about stops also applies to exits. Just move the stop according to the "rules" above...
So it's really that simple? Place your stops at the right price and you will make it!
How can I calculate or estimate the correct stop size? The answer should have something to do with the markets normal variations around it's general direction. But the size of those variations changes constantly hand in hand with volatility. Some even might say that I've just described volatility itself...
Another obvious fact is that the farther away (in the direction opposite to the trend) from the actual market trend I enter, the smaller the stop has to be -> larger positions (MM).
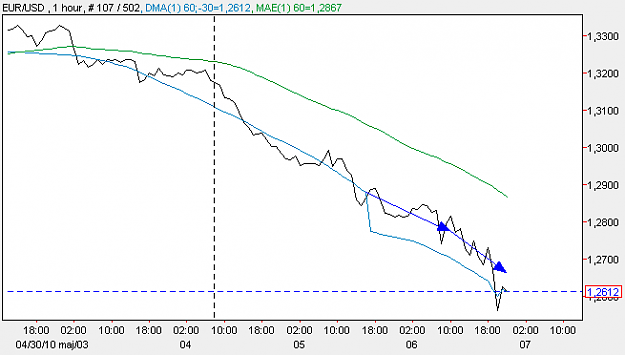
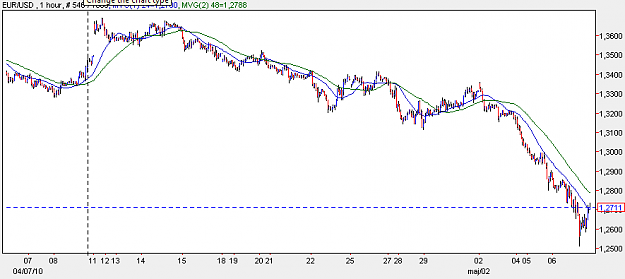
On the above chart (1H) there's a Simple Moving Average calculated on 60 periods (half of a week). It has been pushed back 30 periods, therefore it's in the "center" of price variations. Pretty easy to see the variations around the trends main direction, huh? It's also pretty easy to extrapolate the last 30 periods, see the blue arrows. Then add the rule to trade only WITH the trend on the Daily. How about that?
I have now observed that the last few variations upwards where 50-60 pips away from the center line. So with a stop 100pips away from the extrapolated line, I would be ok, right? On a Daily chart that would be 300-400 pips above.
What do you think of all this? Please let us know!
beam
Facts:
- Price moves up or down.
- Price moves more up than down in an uptrend.
- The direction of the trend can easlily be spotted on a chart. One can also use a Moving Average for indication.
OK, the above is clear to me. In an uptrend I take a long position, right?
What about stops (Money Management)? If I get stopped out, I should be able to get in again later at the same price when the trend direction resumes. The key problem here is the difference between the entry price and the stop. It should be small enough to protect my money if the price moves to far in the wrong direction, and large enough to keep me from getting stopped out too early. This discussion about stops also applies to exits. Just move the stop according to the "rules" above...
So it's really that simple? Place your stops at the right price and you will make it!
How can I calculate or estimate the correct stop size? The answer should have something to do with the markets normal variations around it's general direction. But the size of those variations changes constantly hand in hand with volatility. Some even might say that I've just described volatility itself...
Another obvious fact is that the farther away (in the direction opposite to the trend) from the actual market trend I enter, the smaller the stop has to be -> larger positions (MM).
Attached Image (click to enlarge)
On the above chart (1H) there's a Simple Moving Average calculated on 60 periods (half of a week). It has been pushed back 30 periods, therefore it's in the "center" of price variations. Pretty easy to see the variations around the trends main direction, huh? It's also pretty easy to extrapolate the last 30 periods, see the blue arrows. Then add the rule to trade only WITH the trend on the Daily. How about that?
I have now observed that the last few variations upwards where 50-60 pips away from the center line. So with a stop 100pips away from the extrapolated line, I would be ok, right? On a Daily chart that would be 300-400 pips above.
What do you think of all this? Please let us know!
beam