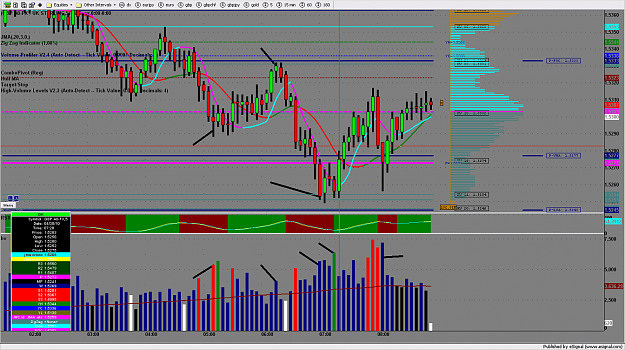
DislikedOk there are a few things going on here, see my chart below.
Firstly, I have drawn 2 S&R lines and a Supply/Demand Delta Zone.
See how many times that the price has hit these lines and retraced. Out of the 11 times it hit these lines, it caused a retrace 10 times and a reversal 1.
Next find the bar marked '1'
1. We are in an up trend with decreasing volume when we get an UT on average volume showing supply coming in.
1+1 Next bar is down as we would expect however beware, the volume is low suggesting that this is a temporary move.
The...Ignored
Thank you very much for your great explanations Intel!!! I guess I'm bombarding this thread with all my questions :-))
That's really nice to see a bit of explanations sometimes ;-)