|
Joined Sep 2006
|
Status: Trend Trader
|277 Posts
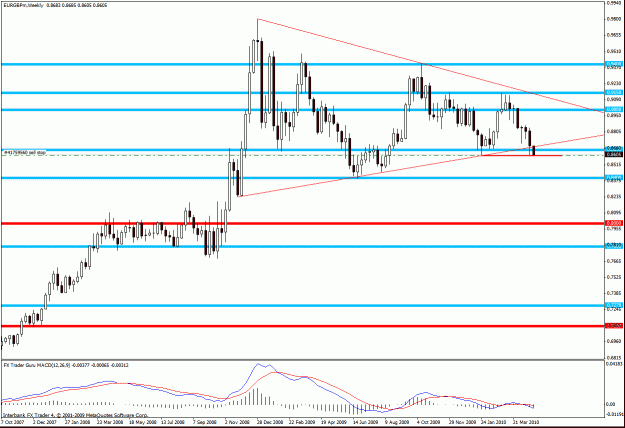
My short on the EURGBP just got filled.
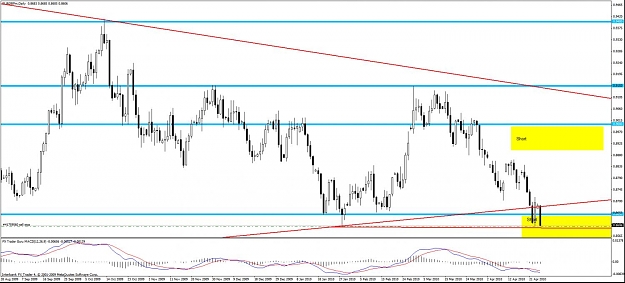
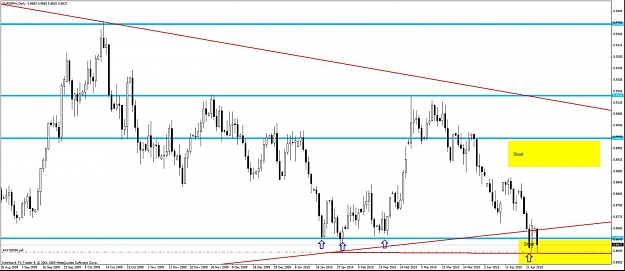
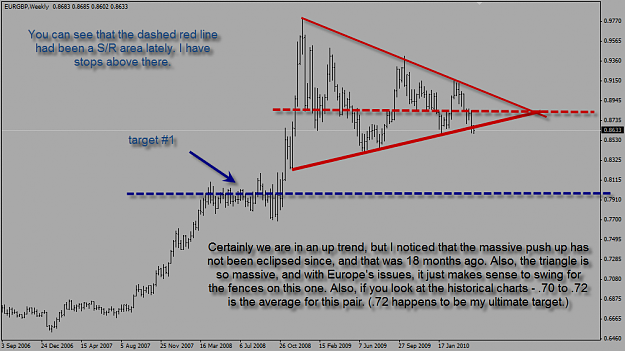
The price has broken out of the triangle to the down side. I waited until the daily chart had tested the underside of the triangle and started back down.
The price has broken out of the triangle to the down side. I waited until the daily chart had tested the underside of the triangle and started back down.
Let's see how this works out.
Ignored
It seems to me that if .86 gives way - look out below!
First time post here. Almost 20% of the way through your fine thread (started about 4 hours ago) and it is a really great insight into understanding PA!!
Like many before me I am practising placing S/R levels on charts for the first time in this "range based" manner.
Would one of the longer standing contributors to this thread be kind enough to post a weekly chart with S/R levels on it for GOLD and also maybe a daily or 4hr (whichever is most relevant at present in your opinion) showing some of the minor support areas.
I am having...
Ignored
Welcome aboard Kumo Vet! You will find this thread run by Chris both refreshing and rewarding as opposed to some of the other threads you have used in the past. Most contributors here are vets themselves and some you probably already know, i.e. Samer960, Calderone...etc! Looking forward to your posts.
The price has broken out of the triangle to the down side. I waited until the daily chart had tested the underside of the triangle and started back down.
Let's see how this works out.
Ignored
I would be terrified to place an order so close to support, perhaps an entry after a successful break and test of 86 would be safer. I would also not like the stop having to be so far away. Good luck with it however it has a good chance if it can get thru the support.
I would be terrified to place an order so close to support, perhaps an entry after a successful break and test of 86 would be safer. I would also not like the stop having to be so far away. Good luck with it however it has a good chance if it can get thru the support.
Larry
Ignored
Not that my 2 cents is worth that of many others here, but I see 86 as being the "bottom" of a support area between 86 and 87. The way I read it as of 1 est today is we had a break of the support around 86.5-87, we had a retest on Friday, and now we are back down near 86. If we break 86, I would bet my extremely small line that there are quite a few sell stops there waiting to greet us on the way down, down, down.
I would want to see how it closed today. It hasn't triggered.....so it's a wash at the moment. If we can get another pinbar, that would certainly be something.....
I would be terrified to place an order so close to support, perhaps an entry after a successful break and test of 86 would be safer. I would also not like the stop having to be so far away. Good luck with it however it has a good chance if it can get thru the support.
Larry
Ignored
The trade is based on something much, much larger. The idea is that we are going to .80 at least, and I still believe .72 is in the cards. Having said that, if you have a 300 pip stop, for instance, it's not that outrageous.
not that my 2 cents is worth that of many others here, but i see 86 as being the "bottom" of a support area between 86 and 87. The way i read it as of 1 est today is we had a break of the support around 86.5-87, we had a retest on friday, and now we are back down near 86. If we break 86, i would bet my extremely small line that there are quite a few sell stops there waiting to greet us on the way down, down, down.
I would be terrified to place an order so close to support, perhaps an entry after a successful break and test of 86 would be safer. I would also not like the stop having to be so far away. Good luck with it however it has a good chance if it can get thru the support.
Larry
Ignored
I understand your view point, but I have my support at 0.8650. It has been tested 4 times starting in Jan, and has finally failed. The bottom of the triangle finally failed as well. There may be a support level at 0.8600 but I believe it will also fail.
|
Joined Apr 2010
|
Status: The Admirable Cretin
|404 Posts
Chris, you mentioned a while ago you have a long term trade on NZDUSD. Is that a long by any chance? Looks like there could be a HUGE bull flag setting up on the weekly chart. Measure THAT pole!
Position trader - Anything intraweek is just noise...
I understand your view point, but I have my support at 0.8650. It has been tested 4 times starting in Jan, and has finally failed. The bottom of the triangle finally failed as well. There may be a support level at 0.8600 but I believe it will also fail.
J
Ignored
Hi mate,
A beginner's question for you, hope you've got a little time to answer it. It's a two fold question:
E/G - do you guys see this as in an overall up trend or down trend? Very simply, I see the charts physically lower on the left side than the right on all the longer timeframes implying that it's still in an overall uptrend.
The reason I ask this is that I am trying to make sure I understand your stop loss placement methods.
In earlier posts CW talks of using minor s/r areas a good place to take profits at in a counter trend trade and a good place to hide stops behind in a trade with the trend.
Where then have you placed your SLs on this particular trade? Some of the guys in thread are talking about large SLs however from what I understand your opinion as to whether this market is in an overall uptrend or downtrend would significantly shift your SL distances?
Welcome aboard Kumo Vet! You will find this thread run by Chris both refreshing and rewarding as opposed to some of the other threads you have used in the past. Most contributors here are vets themselves and some you probably already know, i.e. Samer960, Calderone...etc! Looking forward to your posts.
A beginner's question for you, hope you've got a little time to answer it. It's a two fold question:
E/G - do you guys see this as in an overall up trend or down trend? Very simply, I see the charts physically lower on the left side than the right on all the longer timeframes implying that it's still in an overall uptrend.
The reason I ask this is that I am trying to make sure I understand your stop loss placement methods.
In earlier posts CW talks of using minor s/r areas a good place to take profits at in a counter trend trade and...
Ignored
Sorry to butt in....but here is my chart, keep in mind it won'[t surprise me to be in this trade for months.
Sorry to butt in....but here is my chart, keep in mind it won'[t surprise me to be in this trade for months.
Ignored
Cheers CW much appreciated. I agree that the Euro is certainly in trouble! Just was a bit unclear about the SL placement and how the trend was being interpreted.
To open a sell order in this case would you be looking for an entry 10 pips + spread below the 86 round number or are you guys placing more importance on the break below the rising trend line?