Return Differential Arbitrage
I have my hands in many different projects and areas of study these days, one of those being arbitrage. I see opportunities many times a day between spot and futures prices where pure arbitrage opportunities exist that are big enough to be exploited. Sometimes the spread widens up to around 10 pips long enough to execute the trades manually. I notice this on Oanda BTW.
I bring the above example up to demonstrate a real arb setup where you have identical instruments trading at different prices. Another type of arbitrage exists that uses statistical and quantitative measures for finding spreads in the values of correlated instruments.
The idea is that similar instruments should have similar values. This has to do with what economists call the ‘law of one price.’ That law states: "In an efficient market all identical goods must have only one price." (Wikipedia) If were are using similar instruments the idea becomes tweaked to some degree, but still holds true in many cases.
I’ve been scouring the net for good examples of stat arb or pairs trading only to discover that nothing really exists that is of much value. Maybe it’s out there somewhere, but I could not find it. All the quantitative forums are pretty conservative when it comes to actual strategy discussions. I’m not a huge math buff, so lot’s of what they do goes over my head, but I have begun working on some ideas of my own.
One of the biggest questions throughout my studies was “How do I measure for differences in value between two correlated instruments? “ I have long looked at the correlation of currency pairs over at dailyfx.com using the overlay feature and noticed they use a simple percentage rule. Basically, to measure the correlation between two different pairs, a calculation is started at the same point in time in each pair and the percent change for each pair is tracked as time progresses. There is a fatal flaw though in the dailyfx charts. Their charts begin the correlation calculation at the first bar or candle on the chart, BUT, every new bar on the chart removes the original bar the calculation started on. This removal of one bar each time a new one pops up accelerates the convergence of values in a false way. Usually the pairs are not actually converging, but the calculation keeps getting moved forward, thus giving one the perception that the values are always spreading and converging, spreading and converging ect. The truth is, this relationship can only be seen in hindsight, making the apparent setups untradeable.
So what’s the solution? Simple, the initial point the calculation is started must remain the same. All I’ve been doing is using a modified fib tool and making a percentage change grid on the pairs I’m following. I simply put in whole numbers in my fib (0,1,2,3…), this gives me an equidistant lattice that I can use to track % change instead of price. I usually use the weekly opening prices for each pair because time is the most important factor in these studies. If you start your measurements at different times in each pair, the running relationship between the pairs will be screwed up.
I’ll analyze EU and NZU to serve as an example for the method I’m describing. I’ve taken the opening price from 4/12/2010 in each pair to begin measuring % change in both pairs. When you first start these measurements the pairs are 100% correlated because price has not had a chance to move yet. As time moves on , the pairs will tend to move apart and then back together. Often times the pairs will diverge and then converge a few times within a certain window of time to eventually diverge to larger degrees. Some of these trades can become longer term opportunities. To keep these trades more current, I’d suggest keeping the starting measurements not more than a couple weeks back.
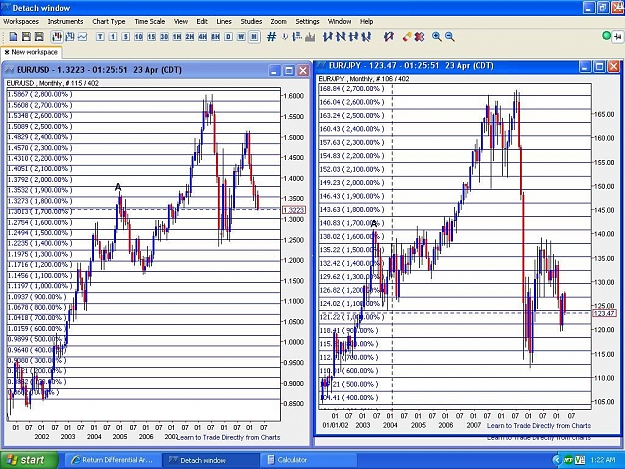
The risk with these trades is called drift. This is where you sell the higher valued instrument and buy the cheaper one only to have the spread in value widen leaving you with two bad positions. This is where keeping your measurements fairly current is helpful. The most efficient way to do these trades would be to make a program that could run through all time points to identify the places with the largest spreads in value. If you know where the largest spreads in value exist, you can pretty safely do a longer term arb trade. For instance, there is a ~ 27% spread in value between EU and EJ, based on a price/time back in 1991. The value spread has opened and closed several times throughout the life of the measurement point, but it was one of the widest points I found in those two pairs. That setup is a sell EU buy EJ trade. If one of you programming gurus out there can come up with an easy way to find these spreads I’d be much appreciative.
I chose to analyze EU and NZU because of their high correlation. I am using Oanda correlation charts to see the correlation.
At this point in time, measuring from 4/12, a .07% spread exists in the pairs. This is a possible buy EU Sell NZU trade. When I plot the grid, I take the starting price and I multiply it by .001 so I know what .01% change in price is per pips. I then plot the fib so that the 0-1 range is that amount of pips. So my grid is setup to show me .01% change increments. I have to do it this way because I have not been able to find an indicator that will let me pick where I want the calculation to start.
One of the problems with these trades is that one pair is usually more volatile than the other, so you have to lessen the position size in the more volatile pair. This can be tricky in itself, but I have had positive results by lessening the position size in the over performer by the factor it has over performer. So if it’s 15% more volatile, I’ll decrease the position size by that amount or increase the position size by 15% in the underperformer.
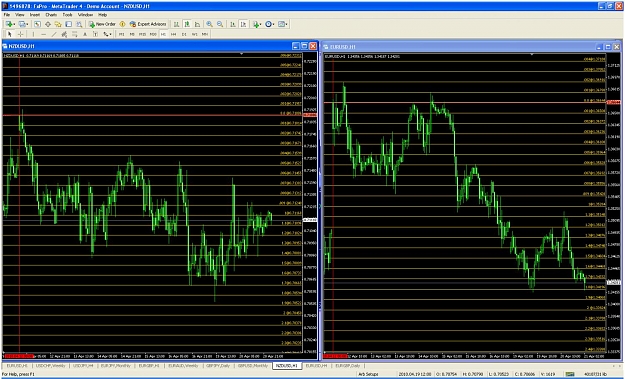
The first attached chart show the current view of the EU NZ trade. The spread at this moment is ~.8% I’ll attach a couple other charts of trades that have happened so far within the same grid.
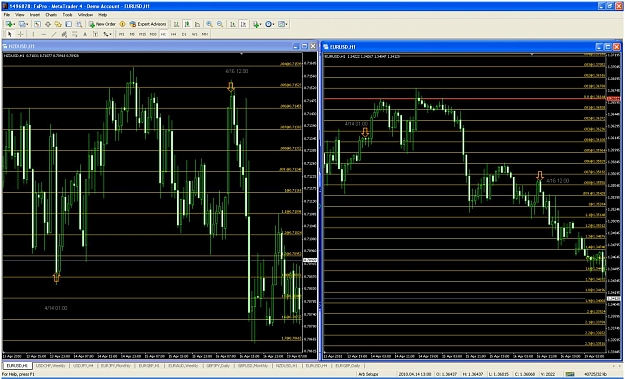
The second chart I’ve attached shows a spread of about 1% on 4/14 @ 01:00 with NZ being a buy and EU being a sell. A couple days later on 4/16 @ 12:00 the spread had completely closed and the pairs actually crossed momentarily. The idea would have been to close the arb trade when the pairs converged to a zero spread condition.
This type of trading is fairly time intensive and I don’t trade it seriously at this point, but I thought that If I could round up some of you to help me flesh it out a little more that it may become more viable. There is a lot of work that needs to be done, mainly statistical work which is not my cup of tea. We need to identify things like maximum spreads in value per time window, and try to come up with some better programming to make the method easier and more efficient to carry out.
Thanks,
Scotty B
I have my hands in many different projects and areas of study these days, one of those being arbitrage. I see opportunities many times a day between spot and futures prices where pure arbitrage opportunities exist that are big enough to be exploited. Sometimes the spread widens up to around 10 pips long enough to execute the trades manually. I notice this on Oanda BTW.
I bring the above example up to demonstrate a real arb setup where you have identical instruments trading at different prices. Another type of arbitrage exists that uses statistical and quantitative measures for finding spreads in the values of correlated instruments.
The idea is that similar instruments should have similar values. This has to do with what economists call the ‘law of one price.’ That law states: "In an efficient market all identical goods must have only one price." (Wikipedia) If were are using similar instruments the idea becomes tweaked to some degree, but still holds true in many cases.
I’ve been scouring the net for good examples of stat arb or pairs trading only to discover that nothing really exists that is of much value. Maybe it’s out there somewhere, but I could not find it. All the quantitative forums are pretty conservative when it comes to actual strategy discussions. I’m not a huge math buff, so lot’s of what they do goes over my head, but I have begun working on some ideas of my own.
One of the biggest questions throughout my studies was “How do I measure for differences in value between two correlated instruments? “ I have long looked at the correlation of currency pairs over at dailyfx.com using the overlay feature and noticed they use a simple percentage rule. Basically, to measure the correlation between two different pairs, a calculation is started at the same point in time in each pair and the percent change for each pair is tracked as time progresses. There is a fatal flaw though in the dailyfx charts. Their charts begin the correlation calculation at the first bar or candle on the chart, BUT, every new bar on the chart removes the original bar the calculation started on. This removal of one bar each time a new one pops up accelerates the convergence of values in a false way. Usually the pairs are not actually converging, but the calculation keeps getting moved forward, thus giving one the perception that the values are always spreading and converging, spreading and converging ect. The truth is, this relationship can only be seen in hindsight, making the apparent setups untradeable.
So what’s the solution? Simple, the initial point the calculation is started must remain the same. All I’ve been doing is using a modified fib tool and making a percentage change grid on the pairs I’m following. I simply put in whole numbers in my fib (0,1,2,3…), this gives me an equidistant lattice that I can use to track % change instead of price. I usually use the weekly opening prices for each pair because time is the most important factor in these studies. If you start your measurements at different times in each pair, the running relationship between the pairs will be screwed up.
I’ll analyze EU and NZU to serve as an example for the method I’m describing. I’ve taken the opening price from 4/12/2010 in each pair to begin measuring % change in both pairs. When you first start these measurements the pairs are 100% correlated because price has not had a chance to move yet. As time moves on , the pairs will tend to move apart and then back together. Often times the pairs will diverge and then converge a few times within a certain window of time to eventually diverge to larger degrees. Some of these trades can become longer term opportunities. To keep these trades more current, I’d suggest keeping the starting measurements not more than a couple weeks back.
The risk with these trades is called drift. This is where you sell the higher valued instrument and buy the cheaper one only to have the spread in value widen leaving you with two bad positions. This is where keeping your measurements fairly current is helpful. The most efficient way to do these trades would be to make a program that could run through all time points to identify the places with the largest spreads in value. If you know where the largest spreads in value exist, you can pretty safely do a longer term arb trade. For instance, there is a ~ 27% spread in value between EU and EJ, based on a price/time back in 1991. The value spread has opened and closed several times throughout the life of the measurement point, but it was one of the widest points I found in those two pairs. That setup is a sell EU buy EJ trade. If one of you programming gurus out there can come up with an easy way to find these spreads I’d be much appreciative.
I chose to analyze EU and NZU because of their high correlation. I am using Oanda correlation charts to see the correlation.
At this point in time, measuring from 4/12, a .07% spread exists in the pairs. This is a possible buy EU Sell NZU trade. When I plot the grid, I take the starting price and I multiply it by .001 so I know what .01% change in price is per pips. I then plot the fib so that the 0-1 range is that amount of pips. So my grid is setup to show me .01% change increments. I have to do it this way because I have not been able to find an indicator that will let me pick where I want the calculation to start.
One of the problems with these trades is that one pair is usually more volatile than the other, so you have to lessen the position size in the more volatile pair. This can be tricky in itself, but I have had positive results by lessening the position size in the over performer by the factor it has over performer. So if it’s 15% more volatile, I’ll decrease the position size by that amount or increase the position size by 15% in the underperformer.
The first attached chart show the current view of the EU NZ trade. The spread at this moment is ~.8% I’ll attach a couple other charts of trades that have happened so far within the same grid.
The second chart I’ve attached shows a spread of about 1% on 4/14 @ 01:00 with NZ being a buy and EU being a sell. A couple days later on 4/16 @ 12:00 the spread had completely closed and the pairs actually crossed momentarily. The idea would have been to close the arb trade when the pairs converged to a zero spread condition.
This type of trading is fairly time intensive and I don’t trade it seriously at this point, but I thought that If I could round up some of you to help me flesh it out a little more that it may become more viable. There is a lot of work that needs to be done, mainly statistical work which is not my cup of tea. We need to identify things like maximum spreads in value per time window, and try to come up with some better programming to make the method easier and more efficient to carry out.
Thanks,
Scotty B
Attached Image(s) (click to enlarge)