What would be a proper TF to observe possible divergences?
Ignored
Anything from 4hr upwards has proven pretty reliable for me, but I do look at the lower TFs too for signs of exhaustion, when price has rallied/dropped strongly.
I know I have been bugging everyone with the "Compression stuff", but if you look at daily chart with all EMA's thrown in, you see that we are getting into a HUGE compression at around 140ish....I think we have to wait for a while to see which side it is gonna spike after to get into the right trade....
here is top but ıt looks like a descending triangle
base can be broken down in asian session
hope ı wont be surprised when ı get up in the morning
good trades
Anything from 4hr upwards has proven pretty reliable for me, but I do look at the lower TFs too for signs of exhaustion, when price has rallied/dropped strongly.
Ignored
Thanks,
sorry to be off-topic, but would you consider this pattern a clear example of bearish divergence?
Attached Image (click to enlarge)
Don't be a hero. Don't have an ego. Always question yourself
A simple way to remember which divergence you're dealing with is to view the location of the divergence lines. If across the top of the PA and oscillator, then it's bearish, if across the bottom of the PA and oscillator, it's bullish. Be careful plotting lines across the middle of the PA; it should be plotted at the extremes of the candles.
A simple way to remember which divergence you're dealing with is to view the location of the divergence lines. If across the top of the PA and oscillator, then it's bearish, if across the bottom of the PA and oscillator, it's bullish. Be careful plotting lines across the middle of the PA; it should be plotted at the extremes of the candles.
Ignored
Ah I see, words finally get a meaning
Thanks a lot
Don't be a hero. Don't have an ego. Always question yourself
Ah I see, words finally get a meaning
Thanks a lot
Ignored
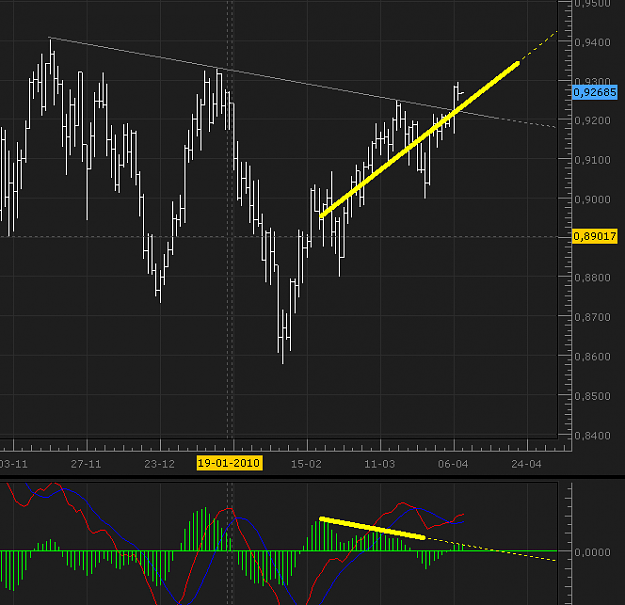
Here's a chart with 2 examples. First one is bearish divergence, (yellow lines). Second is a bit of a cheat, but i'm trying in indicate what bullish divergence would look like.
The bearish divergence btw has not played out yet and won't be considered complete until price reaches the orange box area.
How do you define "played out" (where the orange box is), I can see the down-move after the bearish divergence?
Is it the price level where the bearish divergence starts?
Don't be a hero. Don't have an ego. Always question yourself
How do you define "played out" (where the orange box is), I can see the down-move after the bearish divergence?
Ignored
I look at it like this: (but am happy to concede there are other methods)
The angle of the 2 lines you plot must be in the same direction to be considered played out. So, in my example, if you draw a new line on the price from the low of the divergence across the chart so it's direction matches that of the oscillator.
Same chart, new line.
Attached Image (click to enlarge)
I am conservative in my analysis of this target, so anything under 141 I would consider played out.
Search some of my recent posts from the last week for more examples.
I look at it like this: (but am happy to concede there are other methods)
The angle of the 2 lines you plot must be in the same direction to be considered played out. So, in my example, if you draw a new line on the price from the low of the divergence across the chart so it's direction matches that of the oscillator.
I am conservative in my analysis of this target, so anything under 141 I would consider played out.
Search some of my recent posts from the last week for more examples.
Ignored
Sorry, same direction in this case is "down" or between 45 and 90 degrees.
The steepness of the line on the oscillator in your example is different from the steepness of the price (wite line).
What is the argument choosing the level between 45 and 90 degrees?
Don't be a hero. Don't have an ego. Always question yourself
Sorry, same direction in this case is "down" or between 45 and 90 degrees.
The steepness of the line on the oscillator in your example is different from the steepness of the price.
What is the argument choosing the level between 45 and 90 degrees?
Ignored
The direction has to match, not the exact angle. The reason we get divergences in the first place is because the two lines are either side of the zero line, (if looking at an x y grid).
Divergence plays out when both lines are in the same grid pane.
Simply put, both lines have to be pointing in the same direction, either up or down.
Ignored
All clear thank you very much, already searching
Don't be a hero. Don't have an ego. Always question yourself
Yeah, didn't mean to misquote you Scrat. My apologies.
I just covered about 40% of my shorts down here and am looking to put them back on at 142.60... it looks like we could see a little pop up on some of the lower time frames before a resumption lower.
Yeah, didn't mean to misquote you Scrat. My apologies.
I just covered about 40% of my shorts down here and am looking to put them back on at 142.60... it looks like we could see a little pop up on some of the lower time frames before a resumption lower.
Ignored
Hi Geppy,
Sorry I am at work and don't access to charts.Would you tell us kindly why 142.60?