I have an easy-forex account that lets me trade early on sunday. I took gu buy with a 10 pip spread at 4928 and we are already at 4965. I don't think I am going to set be just yet but will be looking for dips later in the week.
This is my pair for the week to accumulate, I see it having a long way to go up to get back to somewhere it can start to continue to push down again.
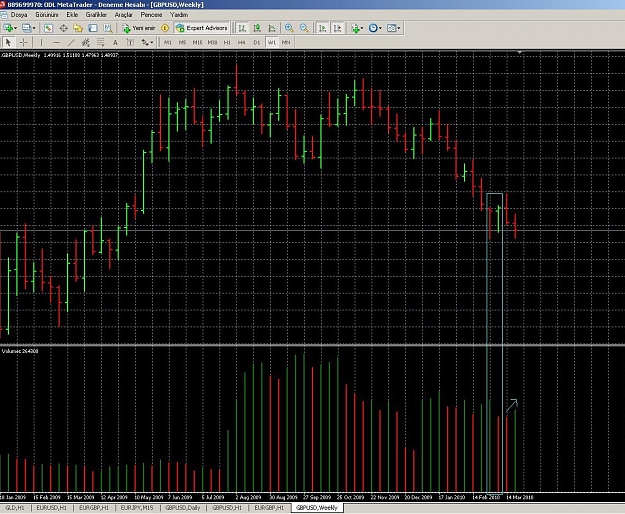
Last week's volume a bit higher than previos week.
On the other hand, last week's price spread is narrower than previous one. In other words, in terms of effort&result, more effort but less result, something resist go further down the price. It's should gone furhet down with more gasoline.
Then, it should mean, there is buying dips, selling climax or.
besides, there are two stopping volumes before these two bars.
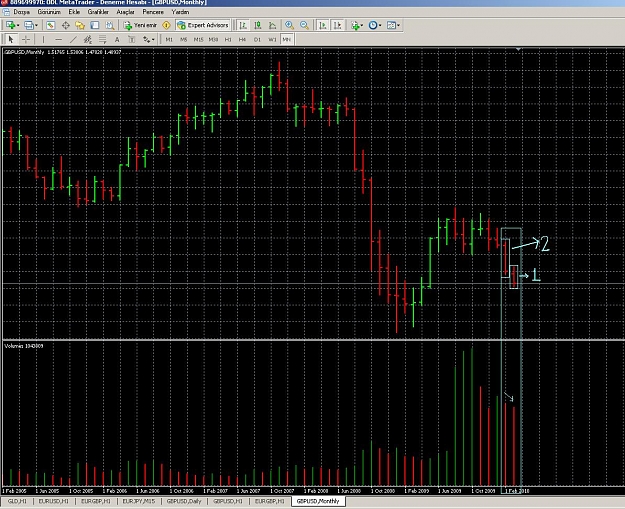
also, if you look at montly graph, march's volume a bit lower, however, february's prices spread is nearly doubled . so, selling is stopped by buying from profs.
or does it mean that selling just got slowed ?
all I understood from the graphs above. do I miss something ?
Last week's volume a bit higher than previos week.
On the other hand, last week's price spread is narrower than previous one. In other words, in terms of effort&result, more effort but less result, something resist go further down the price. It's should gone furhet down with more gasoline.
Then, it should mean, there is buying dips, selling climax or.
besides, there are two stopping volumes before these two bars.
also, if you look at montly graph, march's volume a bit lower, however, february's prices spread...
also something to think about is the ATR of day range
GU daily 14 atr is running baout 150 pip right now.
Tdoast low 1.4891 , makes for a high of about 1.5040 ( with the gap of sunday this may be high ) In fact gu stopped dead on r at 1.5020. So pretty close to days range,
We would need super power coming from US indexes ripping to take GU up thru that resitance , and above the days 14 period ATR
Ignored
Hey malc,
do you use 14 always as your default for ATR?
I don't qualify as a trader. YET. I am only halfway through this thread and still on first reading of MTM, but I like what I have learned so far and expect to join the big boys one day.
Thank you to all who have helped to make this a place where a complete neophyte can learn, and for posting charts and explanations that are understandable. (Well, understandable after MUCH thought!)
Special thanks to Chief1Oar, though I have to say to you also, "what the %&%#8 took you so long to tell me about it??? Thanks, my brother.
the hrly chart for GBPUSD looks like a markup b4 a dive. bearish volume divergence anyone can comments or i see wrongly??
Ignored
it could be markup period. but i dont like mark up phase, cause they can mark up as much as they want, in my opinion.
and news is very positive, do hey sell the good news ?
GU looks very odd to me, not so easy to see a definate move.
I think its getting ready to come down shortly.
It seams to me that although there is weakness about, the price has drifted upwards due to lack of selling pressure rather than a mark up (with the exception of the 06:45 bar on M15 chart.
However, things could go the other way (like I said.....looks a bit odd).
The next 2 hourly bars will show us whats going on for the short term I think.