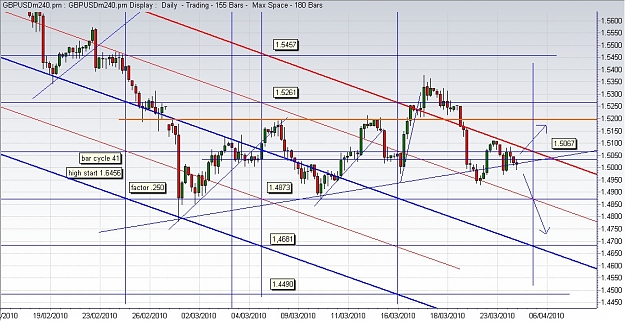
ok, back in business, i am still using my gann roadmap from the higher high of gbpusd (Jan) because its still useful (until now) screen below show we have 2 scenaries, retest of .5200 and maybe breaks to go upside with a huge correction or holding range below .5000 and drop to touch prior gann pivots. (.4873 the most close)
i dont know, i see the chart and yes its could be a kind of irregular triangle (lot of manipulation i saw) or maybe with other eyes... all march month ranging like wide consolidation? waiting to explode down or to upside.
I guess we dont see yet a clear direction, if downtrend will continue or if we will have a good retracement of the last high point (i guess not so high) I am posting this because is the pair i am following and testing with more emphasis with astro-stuff since new year.
What do you think? what is your tech overview?
Attached Image (click to enlarge)