First, thanks to HeavyJ for emailing Vegas and for sharing Vegas' reply. Cool beans HeavyJ!! Thanks!
If I'm reading everyone's posts correctly, I think there is a misunderstanding of the placement of the 24 and 28 EMAs on the charts. In the first email from Vegas, he used the word "respectively" but his sentence structure in the first email did not make it clear what was with respect to what. However, the second email did clear that up. I'll quote the relevant passage here:
The way I read this, one does not put both EMAs on the same chart. In other words, there is no tunnel as on the original one hour system. The word "respectively" in the passage above means, to me at least, that the 24 EMA goes on the daily chart, and the 28 EMA goes on a weekly chart, with this weekly chart being different from the weekly chart used to determine trend.
I agree with xspowerx that the original weekly chart (with the 21 & 5 MAs) is probably no longer used. Instead, the new daily (with 24 EMA & fibs) and weekly (with 28 EMA & fibs) is used. Once these two indicate a potentially strong move is building (and I'm not sure how to do this yet) one would then look at either the original 1 hour chart OR the original 4 hour chart for "confirmation" (Vegas' word) depending on which method was being traded.
See attached image. Does all this make any sense?
Dial
If I'm reading everyone's posts correctly, I think there is a misunderstanding of the placement of the 24 and 28 EMAs on the charts. In the first email from Vegas, he used the word "respectively" but his sentence structure in the first email did not make it clear what was with respect to what. However, the second email did clear that up. I'll quote the relevant passage here:
Quoting VegasDislikedSo, what we do is create daily and weekly charts [any currency pair] and then overlay on these a 24 and 28 ema, respectively. Now we plot the appropriate fib levels onto the daily and weekly charts.
Ignored
I agree with xspowerx that the original weekly chart (with the 21 & 5 MAs) is probably no longer used. Instead, the new daily (with 24 EMA & fibs) and weekly (with 28 EMA & fibs) is used. Once these two indicate a potentially strong move is building (and I'm not sure how to do this yet) one would then look at either the original 1 hour chart OR the original 4 hour chart for "confirmation" (Vegas' word) depending on which method was being traded.
See attached image. Does all this make any sense?
Dial
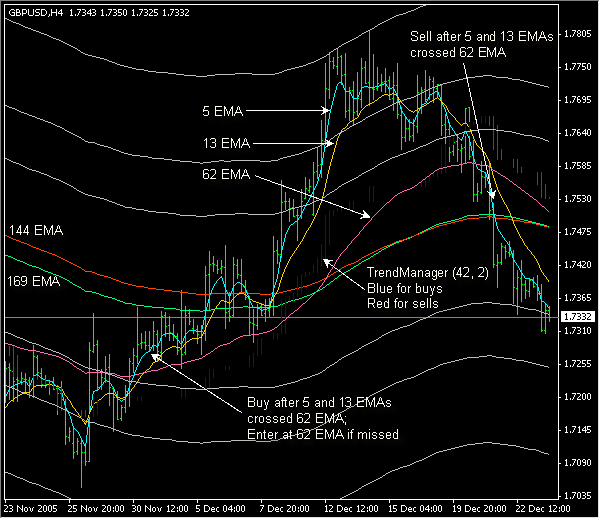
Attached Image
sxaxlxvxaxtxixoxnxbxyxgxrxaxcxexdxoxtxoxrxgx