• Home
  • Forums
  • Trades
  • News
  • Calendar
  • Market
  • Brokers
  • Login
  • Join
  • User/Email: Password:
  • 12:48pm
Menu
  • Forums
  • Trades
  • News
  • Calendar
  • Market
  • Brokers
  • Login
  • Join
  • 12:48pm
Sister Sites
  • Metals Mine
  • Energy EXCH
  • Crypto Craft

Options

Bookmark Thread

First Page First Unread Last Page Last Post

Print Thread

Similar Threads

Top and Bottom “Buy Lower and Sell Higher” 113 replies

MT4 indicator which visually shows top and bottom... 3 replies

Twin Top Bottom Indicator 10 replies

Recent top or Bottom 2 replies

Statistics on Top/Bottom Reversals ? 2 replies

  • Trading Systems
  • /
  • Reply to Thread
  • Subscribe
  • 49
Attachments: Top and Bottom M5 Trade
Exit Attachments

Top and Bottom M5 Trade

  • Last Post
  •  
  • Page 1 2345 6
  • Page 1 234 6
  •  
  • Post #1
  • Quote
  • First Post: Edited Mar 26, 2010 12:36am Feb 12, 2010 11:59pm | Edited Mar 26, 2010 12:36am
  •  harigp
  • Joined Jun 2008 | Status: Divergence Seeker | 1,749 Posts
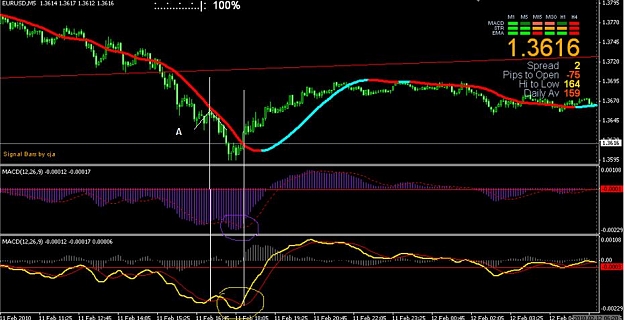
I wish to present the trade in M5 chart by picking the top or Bottom and the Indicators used are

MACD 12,26,9

MACD with crossing 12,26,9

Slope Directional Line

I am attaching some charts on this basis for the members to review
and over a period of two days I will explain these charts and also how to
trade this method. Right now I am in the process of preparing the document .

Basic approach to this trade

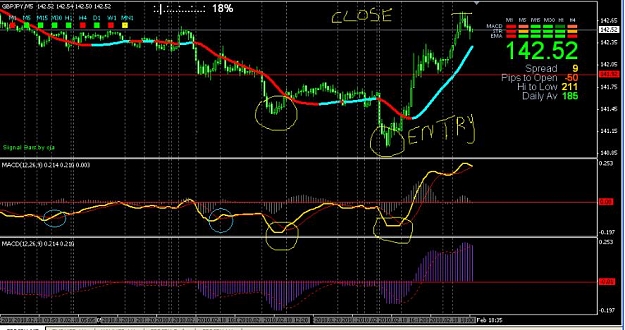
Buy: MACD with crossing as well as MACD both down in M5 Chart

Sell : MACD with crossing as well as MACD both at the Top

But I wish to explain more about MACD and how to prepare for trade
by Looking at the MACD whether the forthcoming trade will be a buy
or Sell

MACD In M 5 provides good explanation of who is going to take charge of
the Market the buyer or seller. MACD also provides the Indication of
trend reversal . The PIP goal is from 10 PIP to 100 PIP depends upon
the market and timing.

UP Date

In M5 chart the EMA 100 is appled to MACD indicator

Drag the Moving average to MACD section and apply to first indicator

If the MACD bars are above EMA 100 in M5 wait for a pull back and enter long .

If the MACD BARS are below EMA 100 in M 5 wait for a pull back to enter short
Attached File
File Type: zip charts.zip   226 KB | 998 downloads
  • Post #2
  • Quote
  • Feb 13, 2010 10:03am Feb 13, 2010 10:03am
  •  billbss
  • Joined Apr 2006 | Status: Member | 4,301 Posts
Since you are using the crossing of the MACD and the signal line, you don't need but one of the MACDs that are displayed. They both show the same thing in that respect.
 
 
  • Post #3
  • Quote
  • Feb 13, 2010 12:23pm Feb 13, 2010 12:23pm
  •  harigp
  • Joined Jun 2008 | Status: Divergence Seeker | 1,749 Posts
Yes I understand but the second MACD in terms of bar gives me some additional comfort of the exhaustion of the buyers or sellers in the market
 
 
  • Post #4
  • Quote
  • Feb 13, 2010 12:31pm Feb 13, 2010 12:31pm
  •  Paulus
  • Joined Dec 2007 | Status: Member | 2,600 Posts
harigp

Why isnt there a signal at A ?
Cheers

Paulus
Attached Image (click to enlarge)
Click to Enlarge

Name: TB.jpg
Size: 66 KB
 
 
  • Post #5
  • Quote
  • Feb 13, 2010 12:38pm Feb 13, 2010 12:38pm
  •  harigp
  • Joined Jun 2008 | Status: Divergence Seeker | 1,749 Posts
I am attaching the gold chart and you can see the fall in gold and how deep the MACD has gone down and there was a similar fall second time which was equal in price terms as shown by the red line but if you see the deepness of MACD at the time of second fall it has not even reached the first MACD fall, signifies the interest in buy
Attached Image (click to enlarge)
Click to Enlarge

Name: gold.gif
Size: 46 KB
 
 
  • Post #6
  • Quote
  • Feb 13, 2010 12:43pm Feb 13, 2010 12:43pm
  •  billbss
  • Joined Apr 2006 | Status: Member | 4,301 Posts
Quoting harigp
Disliked
Yes I understand but the second MACD in terms of bar gives me some additional comfort of the exhaustion of the buyers or sellers in the market
Ignored
But the two are identical, for what you are looking at- the cross of the MACD with the signal line.
 
 
  • Post #7
  • Quote
  • Feb 13, 2010 12:53pm Feb 13, 2010 12:53pm
  •  harigp
  • Joined Jun 2008 | Status: Divergence Seeker | 1,749 Posts
Hi billbss

My first observation is the MACD bar and I cross check the bars with similar price raise or fall because even if I have the cross
I may not enter for trade ASAP but to wait little bit.
 
 
  • Post #8
  • Quote
  • Feb 18, 2010 12:53pm Feb 18, 2010 12:53pm
  •  harigp
  • Joined Jun 2008 | Status: Divergence Seeker | 1,749 Posts
GJ Entry Long based on the attached chart on M 5
Attached Image (click to enlarge)
Click to Enlarge

Name: eu.gif
Size: 40 KB
 
 
  • Post #9
  • Quote
  • Feb 18, 2010 1:12pm Feb 18, 2010 1:12pm
  •  Paulus
  • Joined Dec 2007 | Status: Member | 2,600 Posts
harigp

can you explain in more detail why you took this trade ie

what is each of the inds doing ? what you are looking for in the case of the long ?
why are there no signals at my blue circles ?
and what did you use to gauge the exit ?

also what use is the blue and red ma please ?

cheers

Paulus
Attached Image (click to enlarge)
Click to Enlarge

Name: har.jpg
Size: 81 KB
 
 
  • Post #10
  • Quote
  • Feb 18, 2010 1:25pm Feb 18, 2010 1:25pm
  •  harigp
  • Joined Jun 2008 | Status: Divergence Seeker | 1,749 Posts
Paulus

This entry was based on the divergence noticed in M 5 chart Low and lower low and in the two latest dip the MACD crossover had equal distance.

The indicator in the chart is slope direction

If you type MACD Indicator in the internet lot of eg are given with MACD
Divergence

The blue circles are just to show the low and lower low. I use exit based
on the PA

Right now you can notice similar set up in EU
 
 
  • Post #11
  • Quote
  • Feb 18, 2010 1:47pm Feb 18, 2010 1:47pm
  •  HouseTrader
  • Joined Mar 2008 | Status: ... I was aiming at the horse! | 947 Posts
So you're not looking for the MACD cross, you're looking for the MACD cross AND the divergence (IMO a much better edge than using only MACD crossing...)

It's your preference, but I second Bill... don't see tthe reason for the 2nd MACD window...

And as Paulus asked, how are you using the slope line?

Thanks for sharing!

Cheers!

HT
Many share my views with me. But I don't share them with them...
 
 
  • Post #12
  • Quote
  • Feb 18, 2010 1:56pm Feb 18, 2010 1:56pm
  •  harigp
  • Joined Jun 2008 | Status: Divergence Seeker | 1,749 Posts
MACD crossing is just added comfort factor may be you can avoid. Slope direction line I am using to gauge the PA Strength.
 
 
  • Post #13
  • Quote
  • Feb 18, 2010 2:00pm Feb 18, 2010 2:00pm
  •  Paulus
  • Joined Dec 2007 | Status: Member | 2,600 Posts
ah ok so this is a divergence entry system ?
and the set up on EU is this ?

Paulus
Attached Image (click to enlarge)
Click to Enlarge

Name: div 1.gif
Size: 59 KB
 
 
  • Post #14
  • Quote
  • Feb 18, 2010 2:08pm Feb 18, 2010 2:08pm
  •  Paulus
  • Joined Dec 2007 | Status: Member | 2,600 Posts
and £$

is this your principle..ie

detect the divergence marked by the thumbs up
Enter on the cross marked by the arrow

P
Attached Image (click to enlarge)
Click to Enlarge

Name: div 2.gif
Size: 60 KB
 
 
  • Post #15
  • Quote
  • Feb 18, 2010 2:22pm Feb 18, 2010 2:22pm
  •  harigp
  • Joined Jun 2008 | Status: Divergence Seeker | 1,749 Posts
Paulus

Yes I am having a trade in EU with similar set up like the chart you posted I also look into the MACD bar
deepness compared to the previouse fall to trade for long and for short
Attached Image (click to enlarge)
Click to Enlarge

Name: eu.gif
Size: 37 KB
 
 
  • Post #16
  • Quote
  • Feb 18, 2010 3:33pm Feb 18, 2010 3:33pm
  •  Paulus
  • Joined Dec 2007 | Status: Member | 2,600 Posts
please let me know if you have this one ...

My TP is just the 61.8 retracement of the up move

paulus
Attached Image (click to enlarge)
Click to Enlarge

Name: div 3.gif
Size: 17 KB
 
 
  • Post #17
  • Quote
  • Feb 18, 2010 5:08pm Feb 18, 2010 5:08pm
  •  Paulus
  • Joined Dec 2007 | Status: Member | 2,600 Posts
hmm

pity i didnt trade it on the live account..

TP was the 61.8 retracement level

P
Attached Image (click to enlarge)
Click to Enlarge

Name: div 4.gif
Size: 63 KB
 
 
  • Post #18
  • Quote
  • Feb 18, 2010 10:41pm Feb 18, 2010 10:41pm
  •  harigp
  • Joined Jun 2008 | Status: Divergence Seeker | 1,749 Posts
Paulus

I Looked into that Au chart that was a good entry point . The points I noticed to pick that trade is that when the price fell the sharpness in MACD fall is not very deep plus the support it got compared to the previouse fall.

I like to mention few things about MACD CROSS.

After noticng the good divergence if the macd cross is still playing above the zero line you can pcik few pips if it retrace but shold not cross down
the zero line.

If the MACD crossing is flat switch of the computer and come back later
 
 
  • Post #19
  • Quote
  • Feb 19, 2010 2:45am Feb 19, 2010 2:45am
  •  harigp
  • Joined Jun 2008 | Status: Divergence Seeker | 1,749 Posts
Took a trade in EU M1

Long 1.3466 TP 1.3480

observation for taking long

The previouse fall in EU the MACD was down very deep

The current fall in EU the MACD DOWN was very minimal

MACD crossing indicator supported in the zero Line
Attached Image (click to enlarge)
Click to Enlarge

Name: eu.gif
Size: 40 KB
 
 
  • Post #20
  • Quote
  • Feb 19, 2010 10:50am Feb 19, 2010 10:50am
  •  Paulus
  • Joined Dec 2007 | Status: Member | 2,600 Posts
1min too quick for me and too much noise 5min is just right imo..not alot of noise but not so quite it gets boring ..just picked up a nice trade here
Attached Image (click to enlarge)
Click to Enlarge

Name: div 5.gif
Size: 67 KB
 
 
  • Trading Systems
  • /
  • Top and Bottom M5 Trade
  • Reply to Thread
    • Page 1 2345 6
    • Page 1 234 6
0 traders viewing now
  • More
Top of Page
  • Facebook
  • Twitter
About FF
  • Mission
  • Products
  • User Guide
  • Media Kit
  • Blog
  • Contact
FF Products
  • Forums
  • Trades
  • Calendar
  • News
  • Market
  • Brokers
  • Trade Explorer
FF Website
  • Homepage
  • Search
  • Members
  • Report a Bug
Follow FF
  • Facebook
  • Twitter

FF Sister Sites:

  • Metals Mine
  • Energy EXCH
  • Crypto Craft

Forex Factory® is a brand of Fair Economy, Inc.

Terms of Service / ©2022